Live preview · Letter (8.5" × 11") · Gray lines
Semi-Log Graph Paper (5 Cycle)
Five-cycle semi-log paper covers five powers of ten on the vertical axis, a range of 100,000 to 1. Use it for quantities that vary enormously, where fewer cycles would push points off the page.
Download saves a vector PDF in the size and color selected below, no print dialog needed.
Other formats:
Direct PDF:Semi-Log Graph Paper (5 Cycle) Letter PDFSemi-Log Graph Paper (5 Cycle) A4 PDF
Choose a different paper size:
Choose a different line color:
Great for
- Wide-range decay and attenuation data
- Dose-response and dilution series
- Microbial counts in colony-forming units
- Diode current-voltage characteristics
Semi-Log Graph Paper (5 Cycle) at a glance
| What it is | Semi-logarithmic paper with five cycles, for data spanning a 100,000-fold range. |
|---|---|
| Category | Scientific |
| Paper sizes | Letter (8.5" × 11"), A4 (210 × 297 mm), A5 (148 × 210 mm), Half Letter (5.5" × 8.5"), B5 (176 × 250 mm), Legal (8.5" × 14"), 11" × 17", A3 (297 × 420 mm), A2 (420 × 594 mm), Poster (18" × 24"), Movie Poster (27" × 40") |
| Line colors | Faint, Light, Gray, Dark, Black, Blue, Green (default: Gray) |
| Format | Vector PDF at exact physical scale (Letter PDF, A4 PDF), PNG or SVG, or print directly from the browser |
| Price & license | Free. No signup or watermark. Printed sheets may be used for personal, classroom and commercial work. |
About semi-log graph paper (5 cycle)
Some measurements cover many orders of magnitude: bacterial counts from hundreds to tens of millions, a diode current from microamps to amps, signal levels across a filter's stop band. A five-decade logarithmic axis fits them on one sheet and still shows detail at the small end, which a linear axis would flatten to nothing.
What's on the page
A vertical logarithmic scale of five decades with intermediate lines in each, decade lines heavier and labelled, and a uniform linear grid horizontally. Each decade is about a fifth of the page height, so intermediate lines are close together.
How to use it well
Print larger for precision
On Letter each decade is about 5 cm tall. For finer reading, print on 11×17 or A3.
Use Gray or Dark lines
The intermediate lines are dense; a darker colour keeps the 2 to 9 lines distinct.
Use only the cycles you need
If your data covers three decades, 3 cycle paper will be easier to read.
Common mistakes to avoid
- Over-reading precision. With five decades on one page, values can be read to about one significant figure between lines.
- Plotting values of zero, which have no place on a logarithmic axis.
FAQ, Semi-Log Graph Paper (5 Cycle)
What range does 5 cycle paper cover?+
Five powers of ten, for example 1 to 100,000.
Can I use it for frequency response?+
For gain against frequency use Bode plot paper, which has a logarithmic frequency axis and a linear decibel axis.
Is the paper the same in A4 and Letter?+
The scale has the same five decades; it is stretched to fit the height of whichever sheet you choose.
Printing tips for best results+
- 1. Click Print above. A new tab opens the template at exact size.
- 2. The print dialog appears automatically. Set Scale to 100%. Never "Fit to page", which silently shrinks every cell.
- 3. Set Margins to None or Minimum so the grid reaches the page edge.
- 4. For a PDF, click Download instead. It generates a vector PDF directly without going through the printer driver.
More detail in the guide to printing graph paper at actual size. Need a spacing that isn’t listed? Use the graph paper generator.
You might also like
Scientific
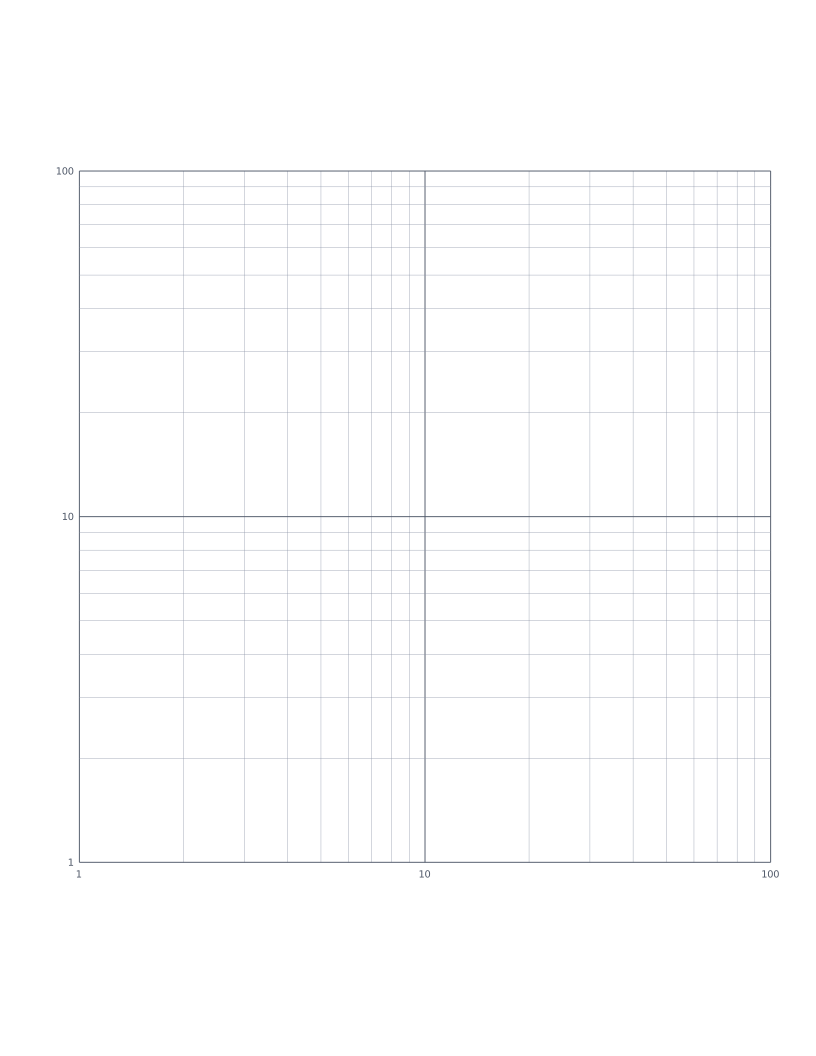
Log-Log Graph Paper (2×2 Cycle)
Full logarithmic paper with two cycles on each axis, for power-law data.
Scientific
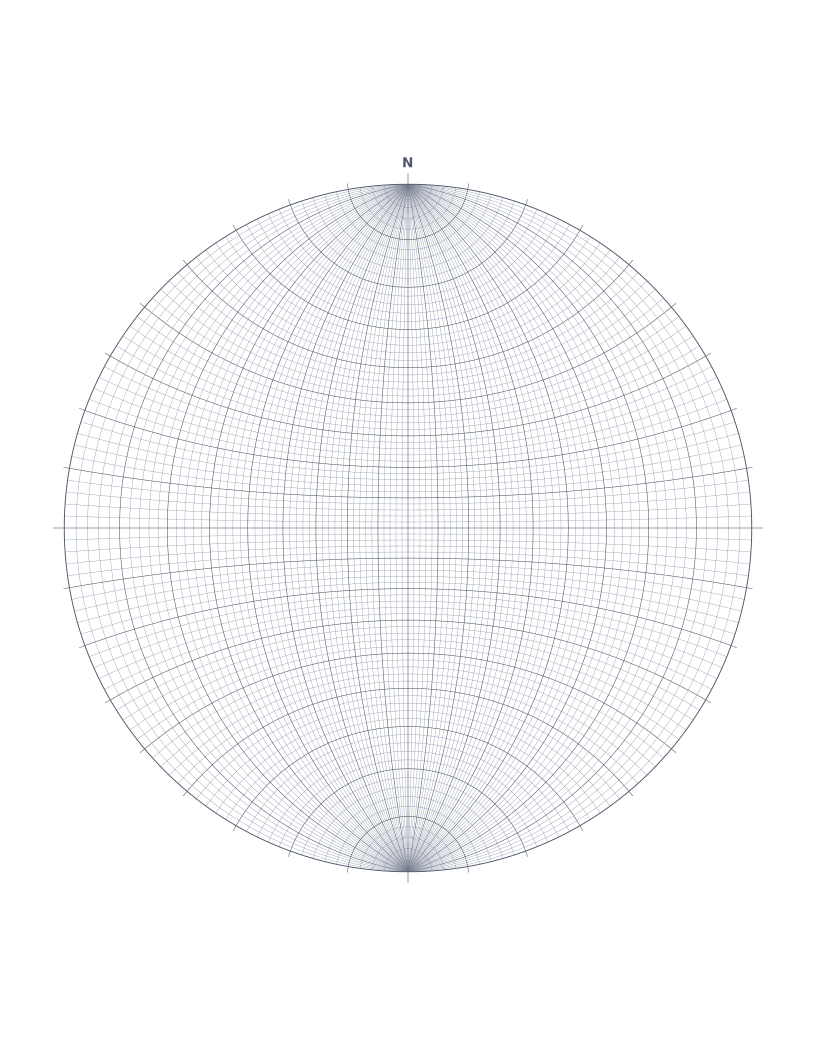
Stereonet (Wulff Net)
Equal-angle stereographic net with great and small circles every 2 degrees.
Scientific
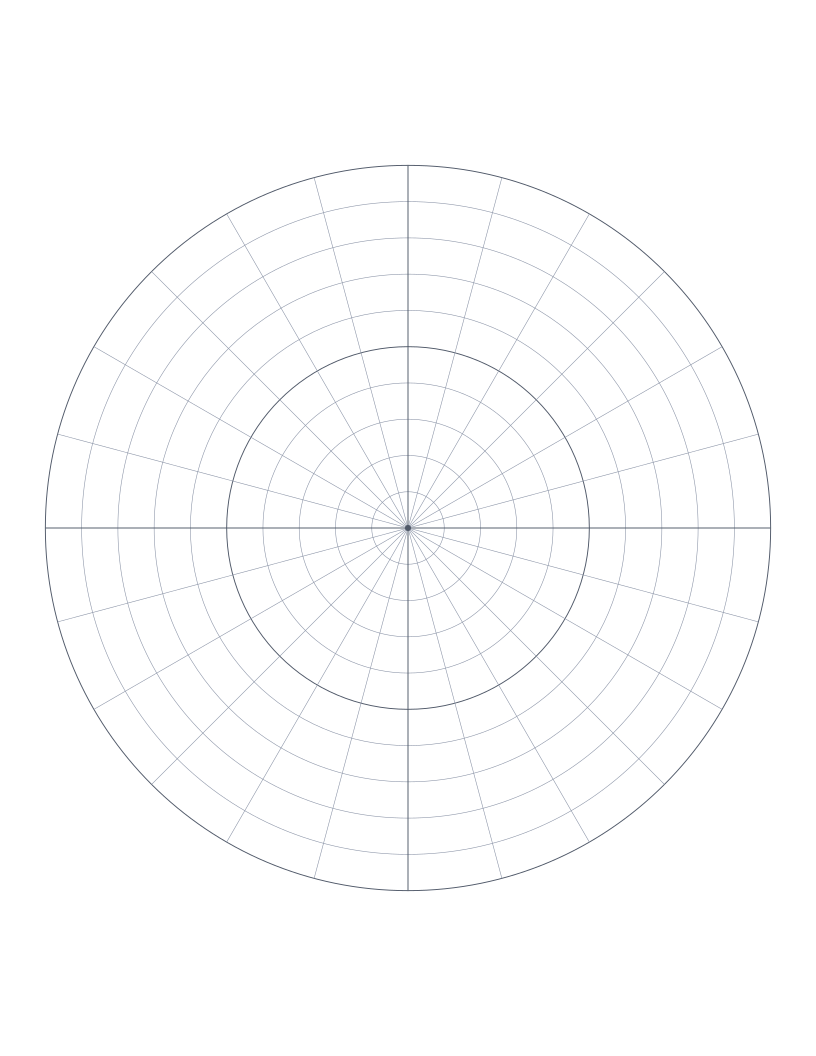
Polar Graph Paper
Concentric circles with radial spokes: for polar coordinates, vector diagrams and circular design.
Scientific
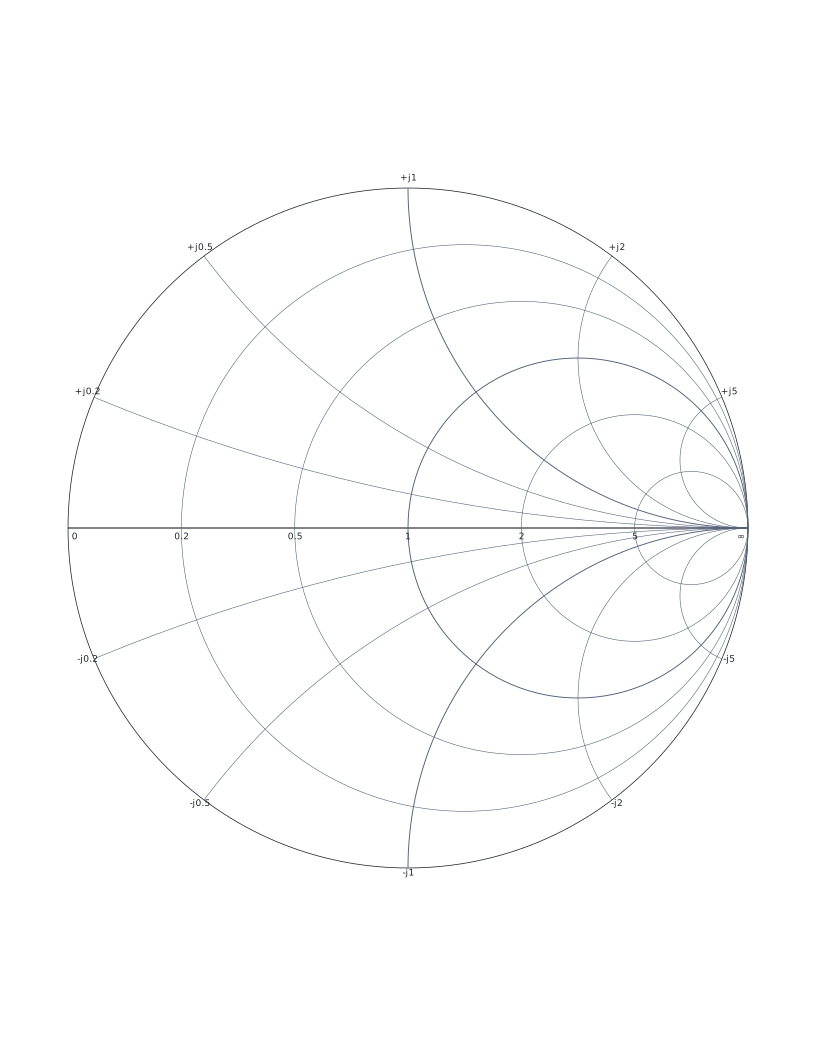
Smith Chart
Classic Smith chart for transmission line impedance matching and RF engineering.