Live preview · Letter (8.5" × 11") · Gray lines
Semi-Log Graph Paper (2 Cycle)
Two-cycle semi-log paper has a logarithmic vertical axis covering two powers of ten, such as 1 to 100, and an ordinary linear horizontal axis. Use it when your data changes by a factor of up to one hundred.
Download saves a vector PDF in the size and color selected below, no print dialog needed.
Other formats:
Direct PDF:Semi-Log Graph Paper (2 Cycle) Letter PDFSemi-Log Graph Paper (2 Cycle) A4 PDF
Choose a different paper size:
Choose a different line color:
Great for
- Exponential growth and decay
- Radioactive half-life experiments
- Capacitor discharge curves
- Bacterial growth over a short range
Semi-Log Graph Paper (2 Cycle) at a glance
| What it is | Semi-logarithmic paper with two cycles on the vertical axis, covering a 100-fold range. |
|---|---|
| Category | Scientific |
| Paper sizes | Letter (8.5" × 11"), A4 (210 × 297 mm), A5 (148 × 210 mm), Half Letter (5.5" × 8.5"), B5 (176 × 250 mm), Legal (8.5" × 14"), 11" × 17", A3 (297 × 420 mm), A2 (420 × 594 mm), Poster (18" × 24"), Movie Poster (27" × 40") |
| Line colors | Faint, Light, Gray, Dark, Black, Blue, Green (default: Gray) |
| Format | Vector PDF at exact physical scale (Letter PDF, A4 PDF), PNG or SVG, or print directly from the browser |
| Price & license | Free. No signup or watermark. Printed sheets may be used for personal, classroom and commercial work. |
About semi-log graph paper (2 cycle)
On semi-log paper, equal distances up the page represent equal ratios rather than equal differences. Any quantity that grows or decays exponentially plots as a straight line, and the slope of that line gives the rate. A cycle, or decade, is one power of ten. Choosing the number of cycles to match the range of your data spreads the points over the whole page; with only two cycles each decade is twice as tall as on 4 cycle paper.
What's on the page
A vertical logarithmic scale of two decades, each divided at 2, 3, 4, 5, 6, 7, 8 and 9, with decade lines heavier and labelled. The horizontal axis is a uniform linear grid.
How to use it well
Relabel the decades
The printed labels are powers of ten starting at 1. If your data runs from 0.1 to 10, write your own values beside them.
Draw the best straight line
If the points fall on a line, the relationship is exponential. Read two well-separated points from the line to find the rate.
Find a half-life
Pick any value on the line and find where the line reaches half of it. The horizontal distance is the half-life.
Common mistakes to avoid
- Trying to plot zero or negative values. A logarithmic axis has no zero.
- Reading between lines as if the scale were linear. The gap from 1 to 2 is much taller than the gap from 8 to 9.
FAQ, Semi-Log Graph Paper (2 Cycle)
What does 2 cycle mean?+
The logarithmic axis spans two powers of ten, for example 1 to 100 or 10 to 1000.
How do I choose the number of cycles?+
Divide your largest value by your smallest. Up to 100 needs two cycles, up to 1000 needs three, and so on.
Which axis is logarithmic?+
The vertical axis. Turn the page sideways if you need the logarithmic axis horizontal.
What if both variables span several powers of ten?+
Use log-log graph paper.
Printing tips for best results+
- 1. Click Print above. A new tab opens the template at exact size.
- 2. The print dialog appears automatically. Set Scale to 100%. Never "Fit to page", which silently shrinks every cell.
- 3. Set Margins to None or Minimum so the grid reaches the page edge.
- 4. For a PDF, click Download instead. It generates a vector PDF directly without going through the printer driver.
More detail in the guide to printing graph paper at actual size. Need a spacing that isn’t listed? Use the graph paper generator.
You might also like
Scientific
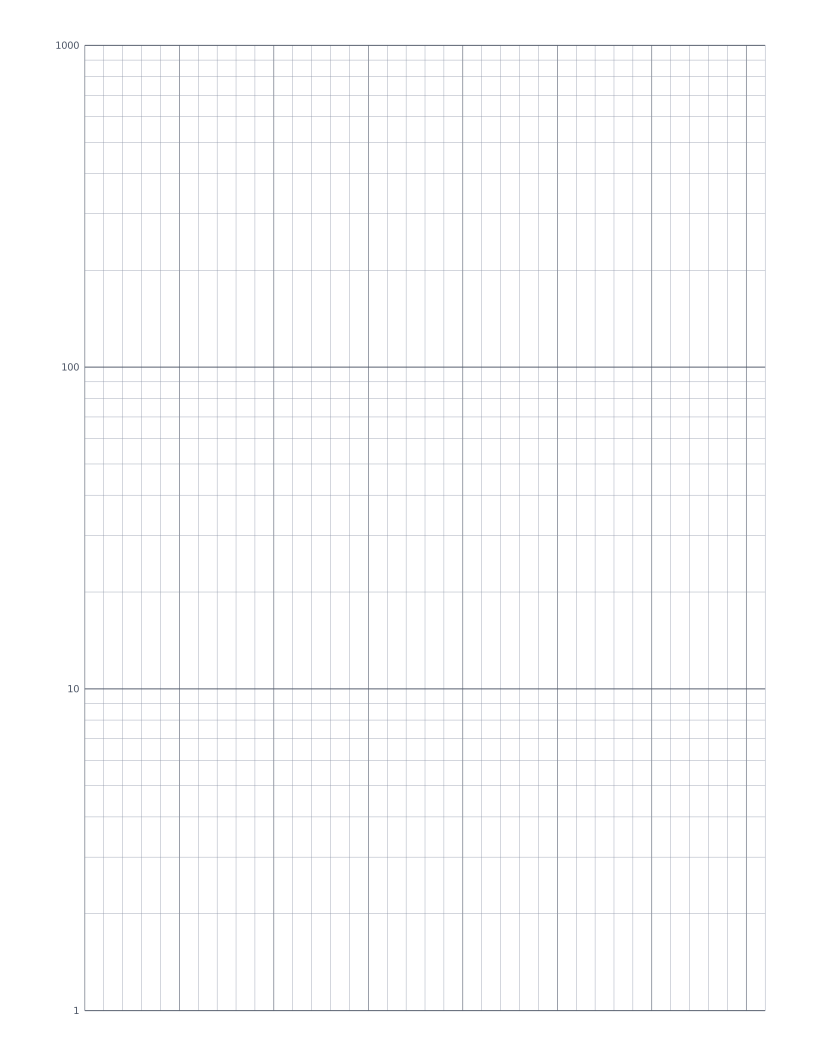
Semi-Log Graph Paper (3 Cycle)
Semi-logarithmic paper with three cycles on the vertical axis, covering a 1000-fold range.
Scientific
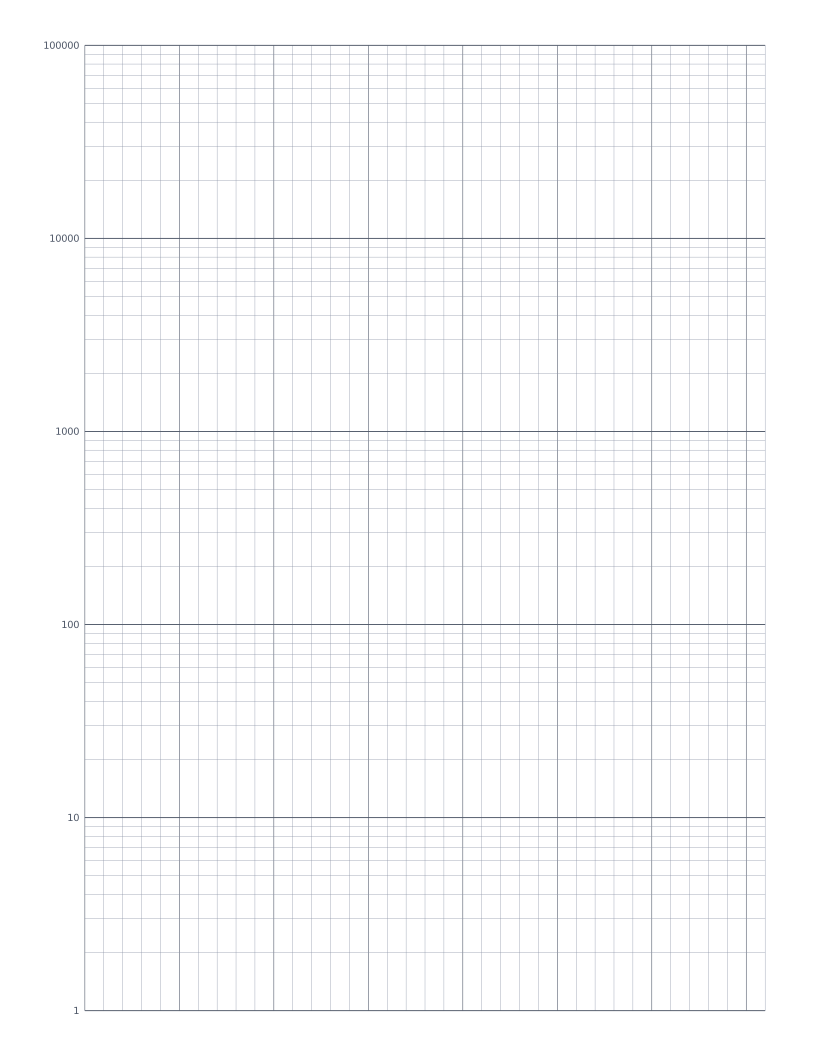
Semi-Log Graph Paper (5 Cycle)
Semi-logarithmic paper with five cycles, for data spanning a 100,000-fold range.
Scientific
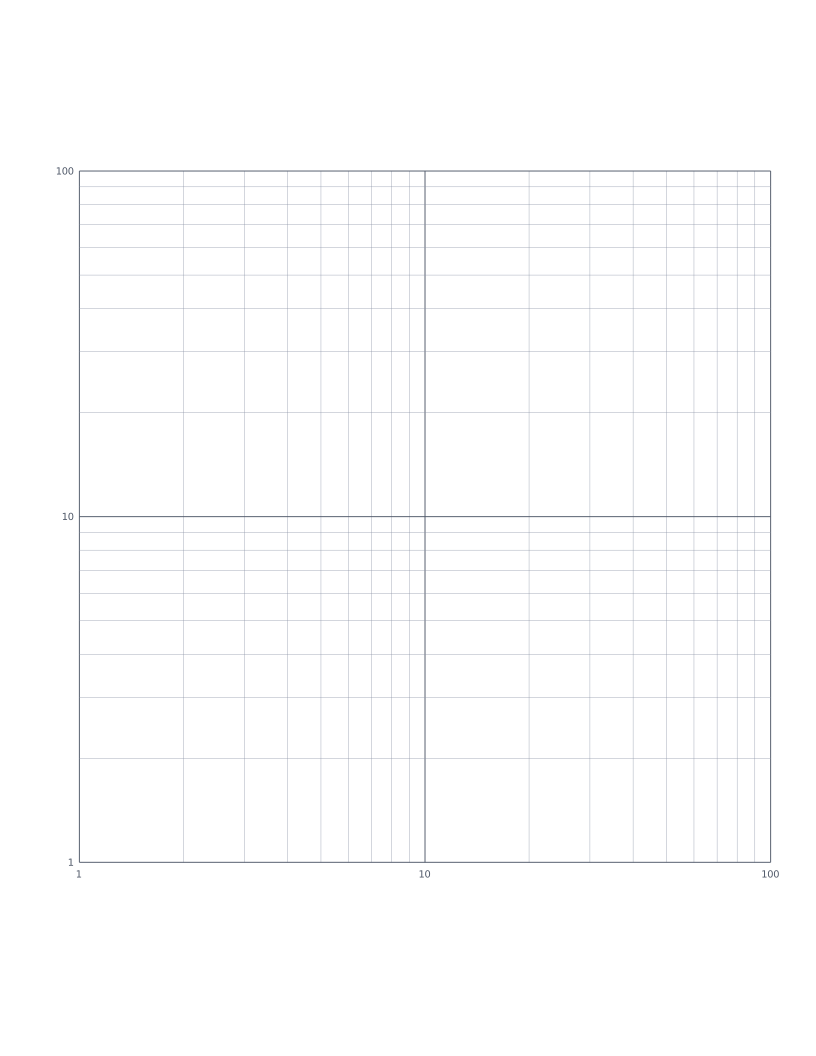
Log-Log Graph Paper (2×2 Cycle)
Full logarithmic paper with two cycles on each axis, for power-law data.
Scientific
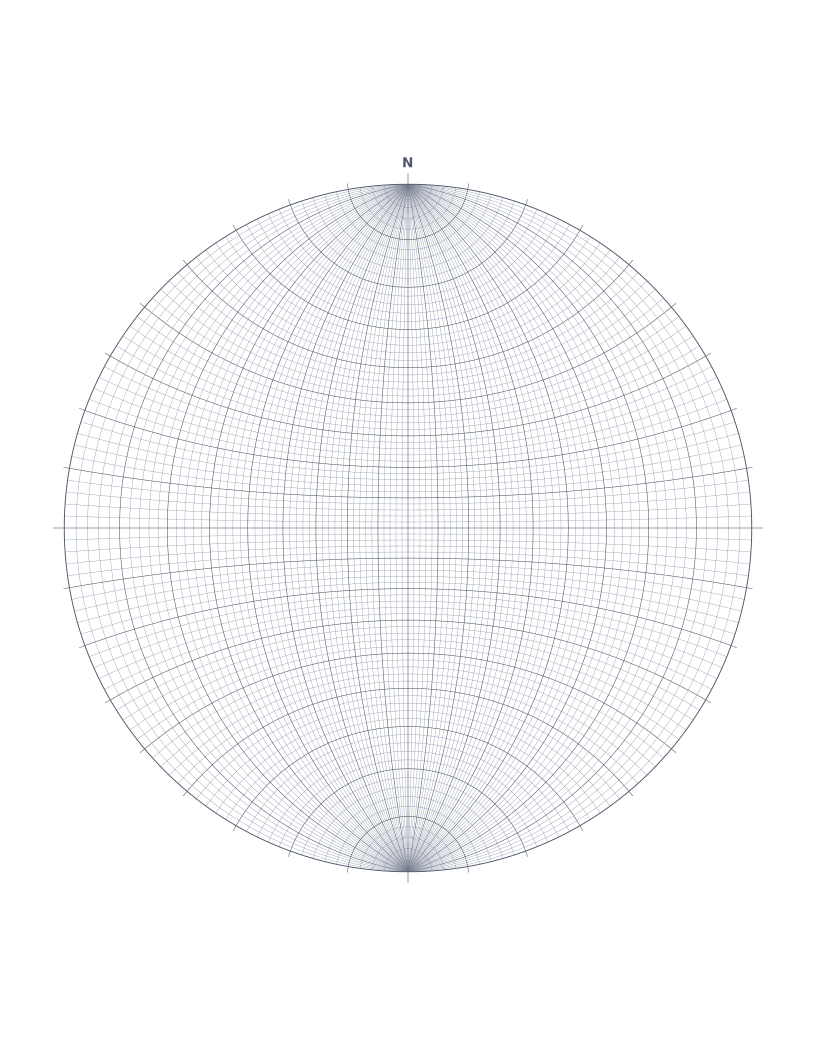
Stereonet (Wulff Net)
Equal-angle stereographic net with great and small circles every 2 degrees.