Live preview · Letter (8.5" × 11") · Gray lines
Log-Log Graph Paper (2×2 Cycle)
Log-log paper has logarithmic scales on both axes. This sheet has two cycles each way, so it suits data where both variables change by up to a factor of one hundred.
Download saves a vector PDF in the size and color selected below, no print dialog needed.
Other formats:
Direct PDF:Log-Log Graph Paper (2×2 Cycle) Letter PDFLog-Log Graph Paper (2×2 Cycle) A4 PDF
Choose a different paper size:
Choose a different line color:
Great for
- Power-law relationships such as y = a·xⁿ
- Pendulum, orbit and scaling experiments
- Flow rate against pressure
- Allometric and fractal data
Log-Log Graph Paper (2×2 Cycle) at a glance
| What it is | Full logarithmic paper with two cycles on each axis, for power-law data. |
|---|---|
| Category | Scientific |
| Paper sizes | Letter (8.5" × 11"), A4 (210 × 297 mm), A5 (148 × 210 mm), Half Letter (5.5" × 8.5"), B5 (176 × 250 mm), Legal (8.5" × 14"), 11" × 17", A3 (297 × 420 mm), A2 (420 × 594 mm), Poster (18" × 24"), Movie Poster (27" × 40") |
| Line colors | Faint, Light, Gray, Dark, Black, Blue, Green (default: Gray) |
| Format | Vector PDF at exact physical scale (Letter PDF, A4 PDF), PNG or SVG, or print directly from the browser |
| Price & license | Free. No signup or watermark. Printed sheets may be used for personal, classroom and commercial work. |
About log-log graph paper (2×2 cycle)
When y is proportional to a power of x, plotting log y against log x gives a straight line whose slope is the exponent. Log-log paper does the logarithms for you. With equal cycle lengths on both axes, as here, the slope can be measured directly with a ruler: rise divided by run equals the power n.
What's on the page
Two logarithmic decades horizontally and two vertically, drawn the same length so the plotting area is square, each divided at 2 to 9, with decade lines heavier and labelled. For a wider range see the 3 × 4 cycle log-log paper.
How to use it well
Measure the slope with a ruler
Draw the best straight line, then measure its rise and run in millimetres. Their ratio is the exponent, provided the decades are the same length on both axes.
Read the constant at x = 1
Where the line crosses x = 1, the y value is the constant a in y = a·xⁿ.
Relabel as needed
Decades can start at any power of ten. Write your own values if your data begins at 0.01 or 100.
Common mistakes to avoid
- Expecting exponential data to be straight. Exponentials are straight on semi-log paper, not log-log.
- Measuring slope with a ruler on paper whose decades differ in length. On this sheet they are equal; on the 3 × 4 cycle paper they are stretched to fill the page, so calculate the slope from the values instead.
FAQ, Log-Log Graph Paper (2×2 Cycle)
What does 2×2 cycle mean?+
Two powers of ten on the horizontal axis and two on the vertical axis.
What kind of data is straight on log-log paper?+
Power laws, where one quantity is proportional to another raised to a fixed power.
Is there a larger range?+
Yes, the 3 × 4 cycle log-log paper.
Can I plot zero?+
No. Neither axis has a zero.
Printing tips for best results+
- 1. Click Print above. A new tab opens the template at exact size.
- 2. The print dialog appears automatically. Set Scale to 100%. Never "Fit to page", which silently shrinks every cell.
- 3. Set Margins to None or Minimum so the grid reaches the page edge.
- 4. For a PDF, click Download instead. It generates a vector PDF directly without going through the printer driver.
More detail in the guide to printing graph paper at actual size. Need a spacing that isn’t listed? Use the graph paper generator.
You might also like
Scientific
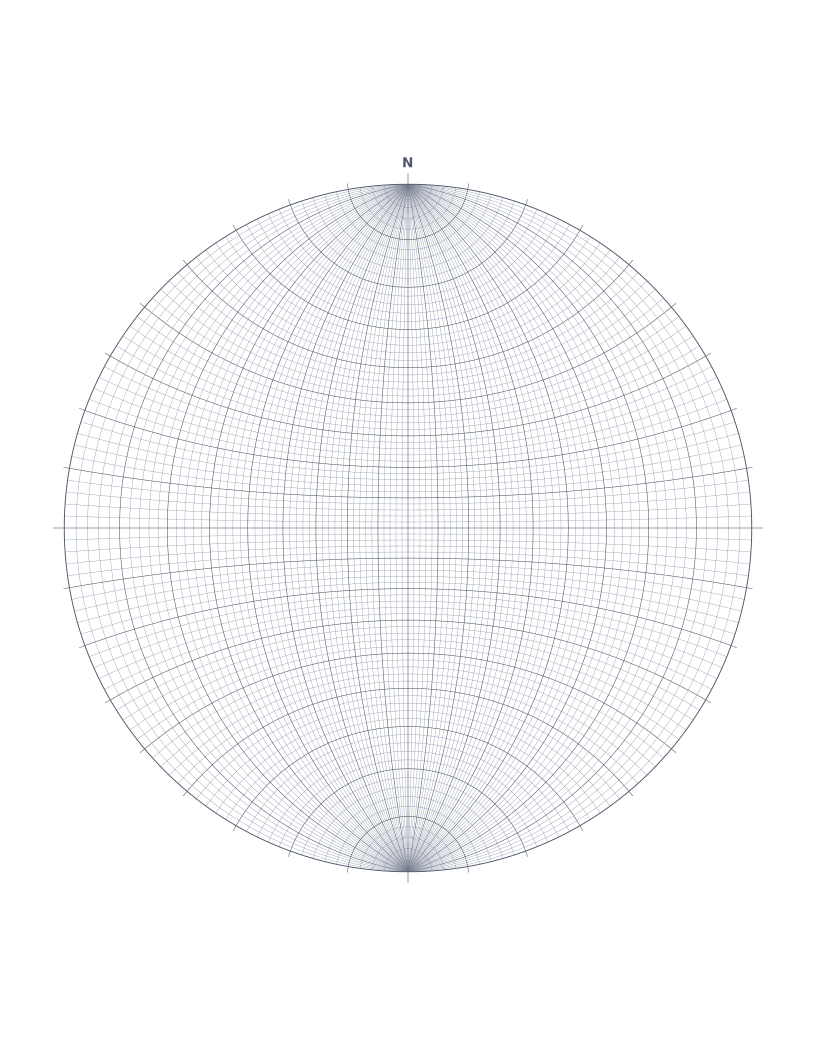
Stereonet (Wulff Net)
Equal-angle stereographic net with great and small circles every 2 degrees.
Scientific
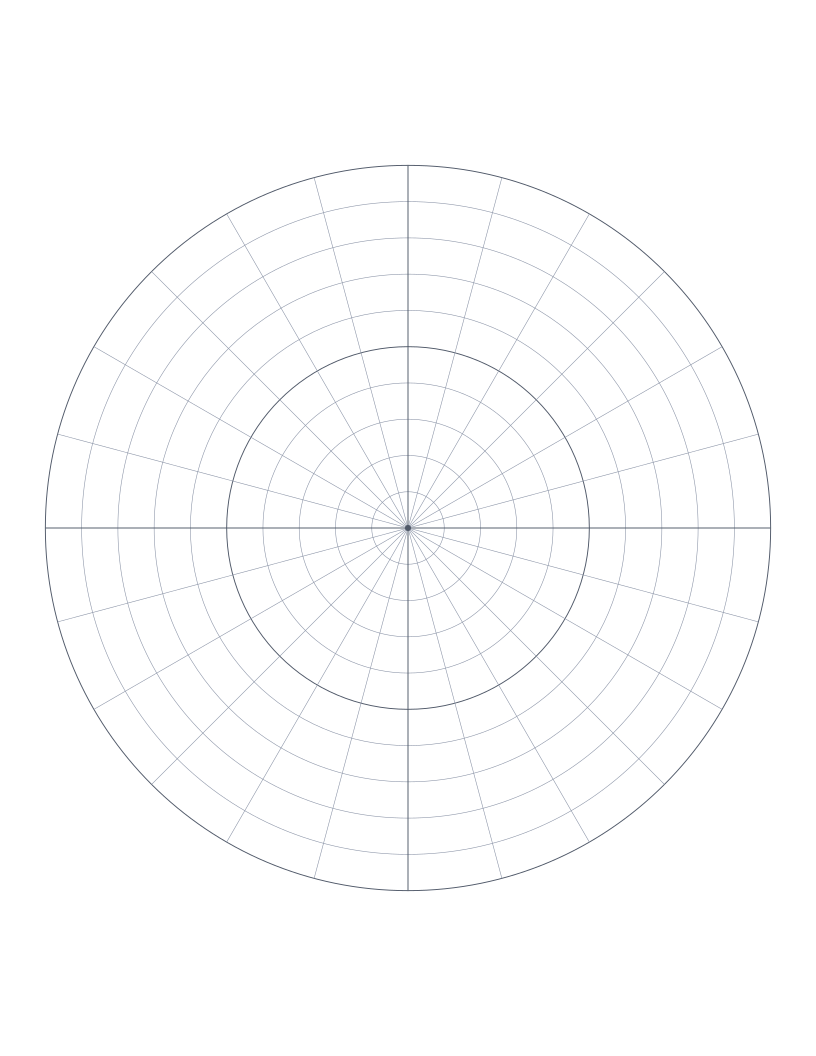
Polar Graph Paper
Concentric circles with radial spokes: for polar coordinates, vector diagrams and circular design.
Scientific
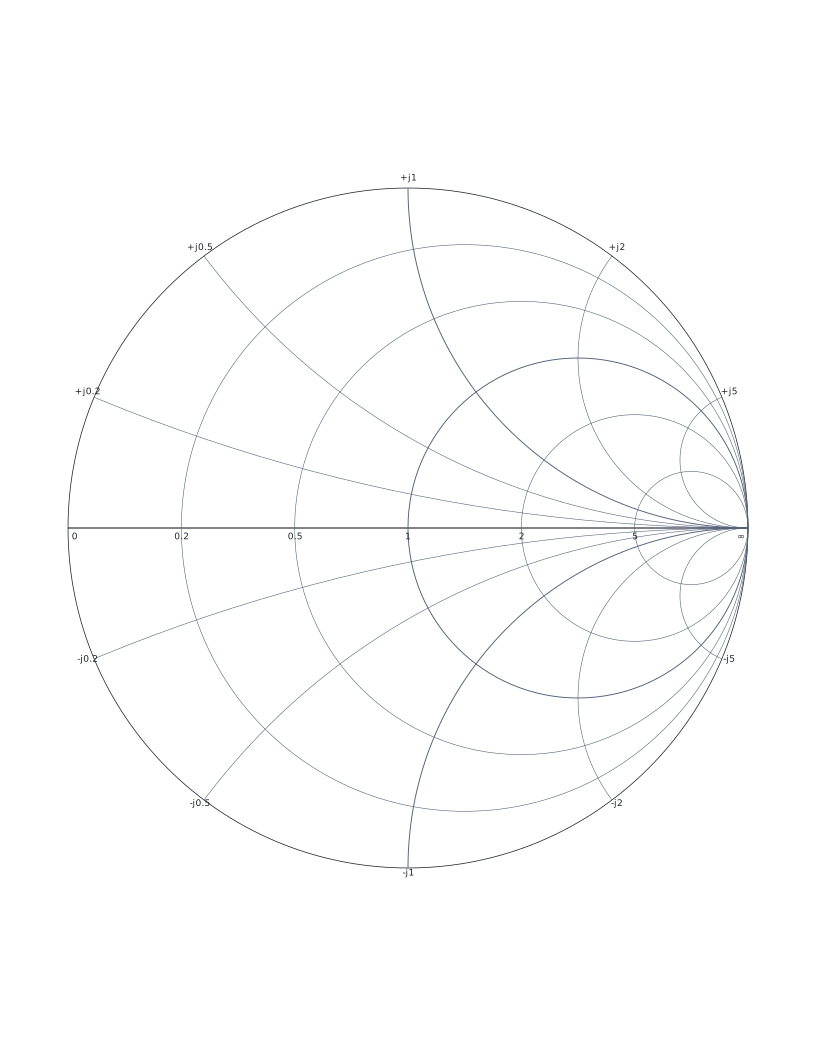
Smith Chart
Classic Smith chart for transmission line impedance matching and RF engineering.
Scientific
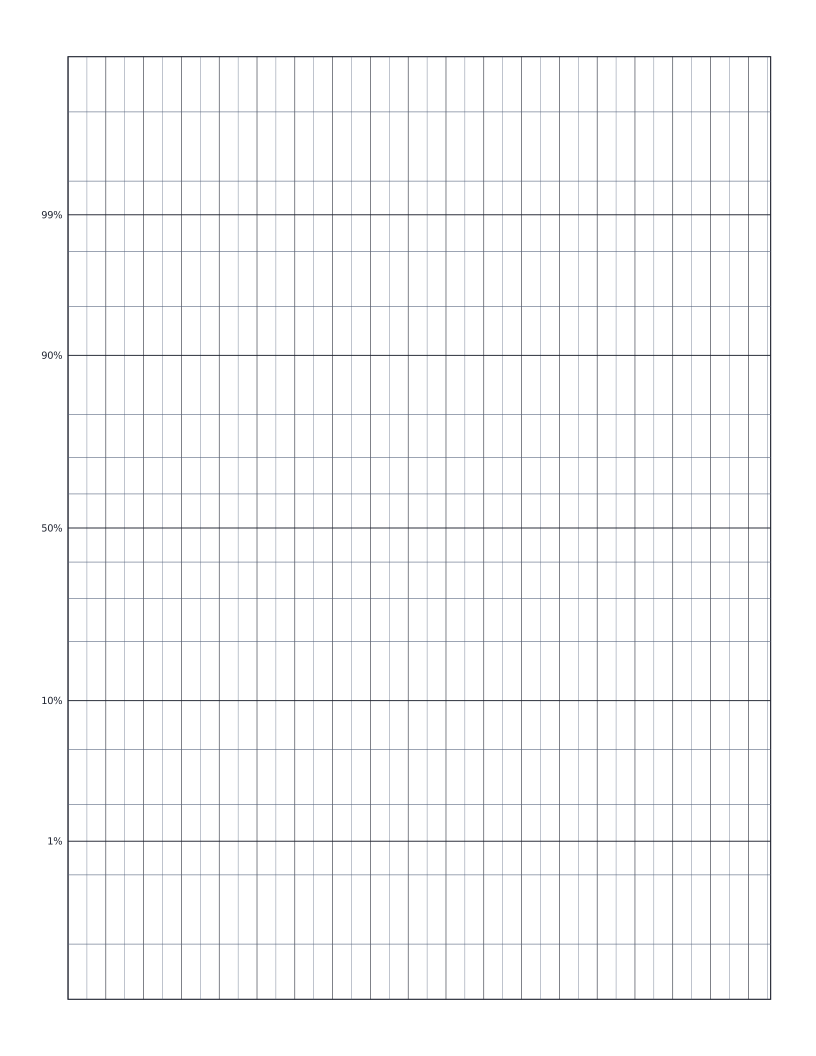
Normal Probability Paper
Normal probability paper: y-axis scaled by inverse normal CDF for plotting distribution data.