Live preview · Letter (8.5" × 11") · Gray lines
Stereonet (Wulff Net)
A Wulff net is the equal-angle stereographic net used to plot the orientation of planes and lines in three dimensions on a flat sheet. This one has great circles and small circles every 2°, with every 10° drawn heavier.
Download saves a vector PDF in the size and color selected below, no print dialog needed.
Other formats:
Direct PDF:Stereonet (Wulff Net) Letter PDFStereonet (Wulff Net) A4 PDF
Choose a different paper size:
Choose a different line color:
Great for
- Structural geology: bedding, faults and folds
- Crystallography and mineralogy
- Rock slope stability analysis
- Teaching stereographic projection
Stereonet (Wulff Net) at a glance
| What it is | Equal-angle stereographic net with great and small circles every 2 degrees. |
|---|---|
| Category | Scientific |
| Paper sizes | Letter (8.5" × 11"), A4 (210 × 297 mm), A5 (148 × 210 mm), Half Letter (5.5" × 8.5"), B5 (176 × 250 mm), Legal (8.5" × 14"), 11" × 17", A3 (297 × 420 mm), A2 (420 × 594 mm), Poster (18" × 24"), Movie Poster (27" × 40") |
| Line colors | Faint, Light, Gray, Dark, Black, Blue, Green (default: Gray) |
| Format | Vector PDF at exact physical scale (Letter PDF, A4 PDF), PNG or SVG, or print directly from the browser |
| Price & license | Free. No signup or watermark. Printed sheets may be used for personal, classroom and commercial work. |
About stereonet (wulff net)
Stereographic projection maps directions on a sphere onto a circle. On the Wulff net, named after the crystallographer George Wulff, angles between lines are preserved, which makes it the standard net in crystallography and for kinematic analysis of rock slopes. The curves running from pole to pole are great circles, representing planes of different dip; the curves crossing them are small circles, used to measure angles within a plane. Geologists who need to contour the density of poles use the equal-area Schmidt net instead.
What's on the page
A primitive circle with tick marks every 10° and north marked at the top. Inside it, great circles and small circles are drawn every 2°, with every 10° heavier, plus the north-south and east-west diameters.
How to use it well
Work on tracing paper
Pin a sheet of tracing paper through the centre of the net so it can rotate. Mark north on the overlay before plotting anything.
Plot a plane
Rotate the overlay until the strike mark is at north, count the dip in from the edge along the east-west line, and trace the great circle through that point.
Print on heavy paper
The net is a tool you reuse. Card stock or a laminated print survives the pin and repeated rotation.
Common mistakes to avoid
- Using it to contour pole density. Equal-angle nets distort area; contouring should be done on an equal-area (Schmidt) net.
- Printing with scaling. It does not affect angles, but a net and overlay printed at different scales will not match.
FAQ, Stereonet (Wulff Net)
What is the difference between a Wulff net and a Schmidt net?+
The Wulff net is equal-angle: it preserves angles. The Schmidt net is equal-area: it preserves area, which matters when contouring the density of plotted points.
What interval are the lines?+
Every 2 degrees, with a heavier line every 10 degrees.
Do I need tracing paper?+
For most constructions, yes. Data is plotted on a rotating overlay, not on the net itself.
Is there polar paper for ordinary graphs?+
Yes, polar graph paper.
Printing tips for best results+
- 1. Click Print above. A new tab opens the template at exact size.
- 2. The print dialog appears automatically. Set Scale to 100%. Never "Fit to page", which silently shrinks every cell.
- 3. Set Margins to None or Minimum so the grid reaches the page edge.
- 4. For a PDF, click Download instead. It generates a vector PDF directly without going through the printer driver.
More detail in the guide to printing graph paper at actual size. Need a spacing that isn’t listed? Use the graph paper generator.
You might also like
Scientific
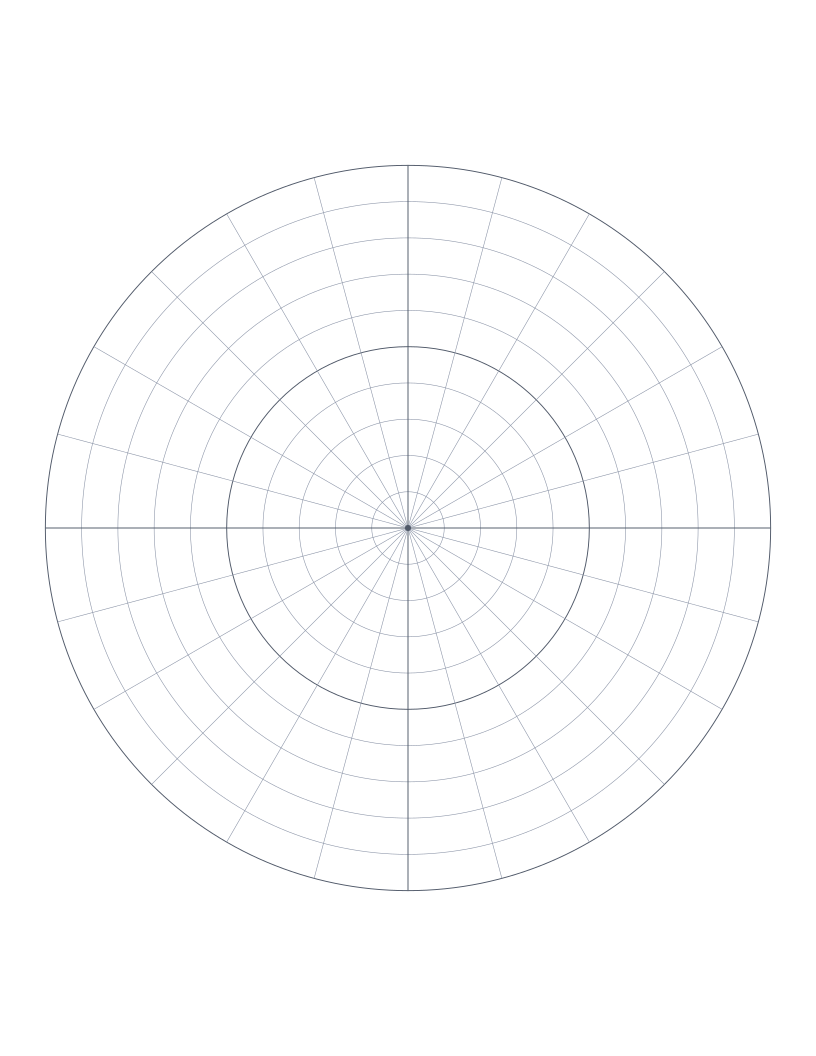
Polar Graph Paper
Concentric circles with radial spokes: for polar coordinates, vector diagrams and circular design.
Scientific
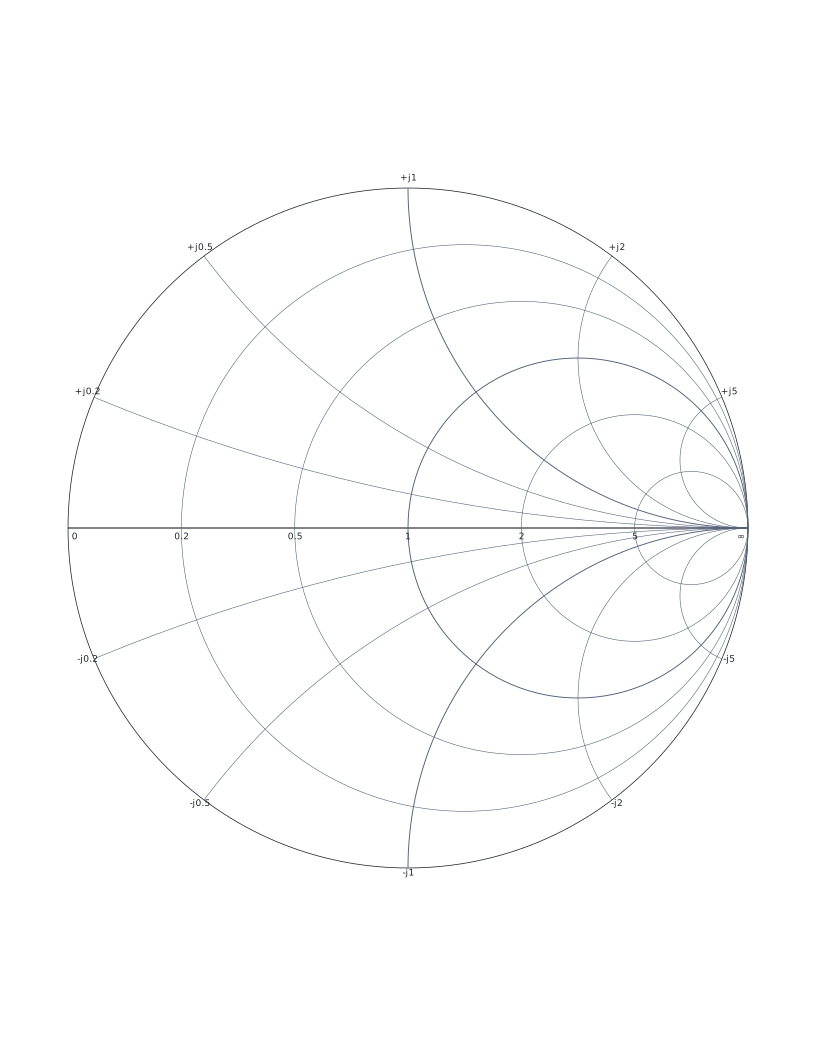
Smith Chart
Classic Smith chart for transmission line impedance matching and RF engineering.
Scientific
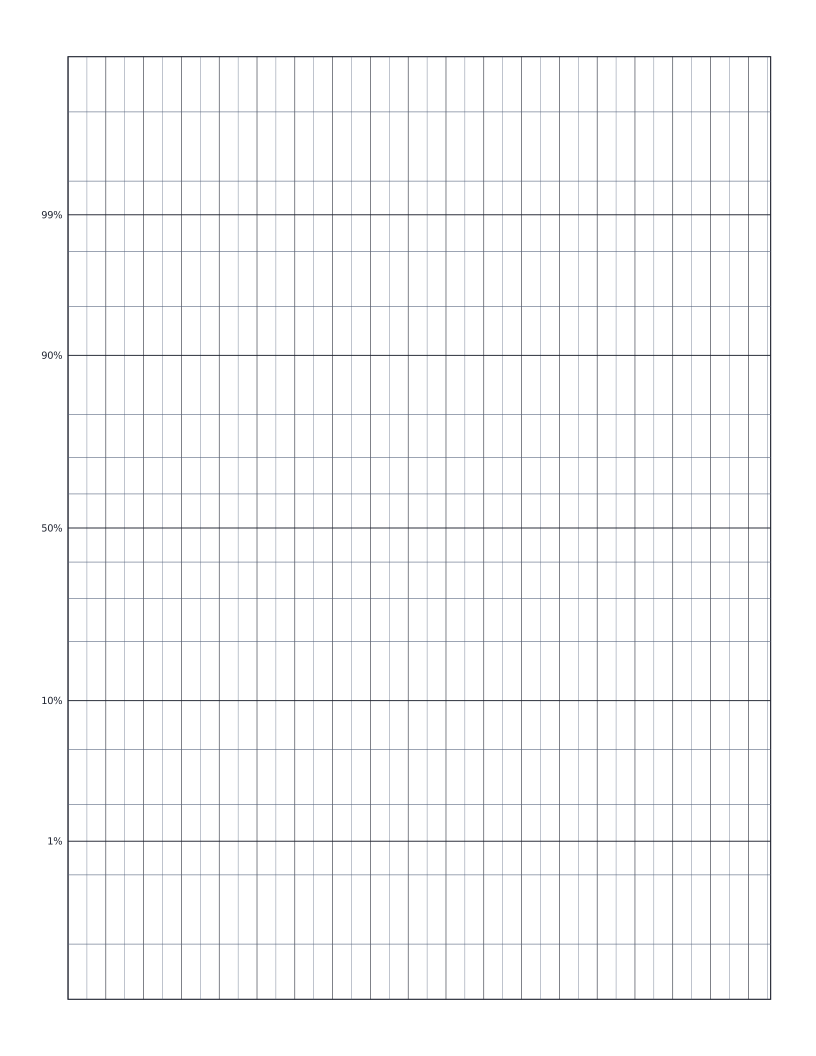
Normal Probability Paper
Normal probability paper: y-axis scaled by inverse normal CDF for plotting distribution data.
Scientific
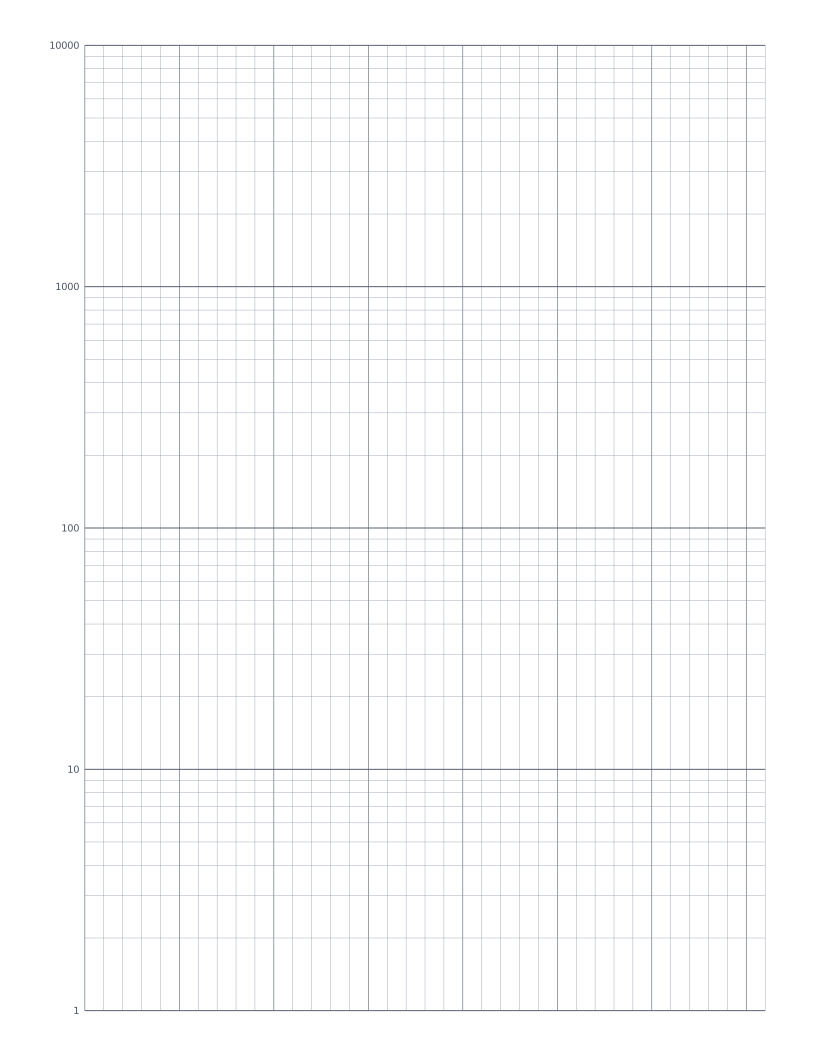
Semi-Log Graph Paper
Linear x-axis with a 4-decade logarithmic y-axis: the standard sheet for plotting exponentials and decay curves.