Scientific & engineering graph paper
Specialised plotting paper for science and engineering: semi-log and log-log paper, polar coordinates, Smith charts, normal probability paper, Bode and Nyquist plot paper, ternary diagrams and a blank periodic table.
9 free templates · Letter, A4 and larger sizes · Vector PDF or direct print
All scientific templates
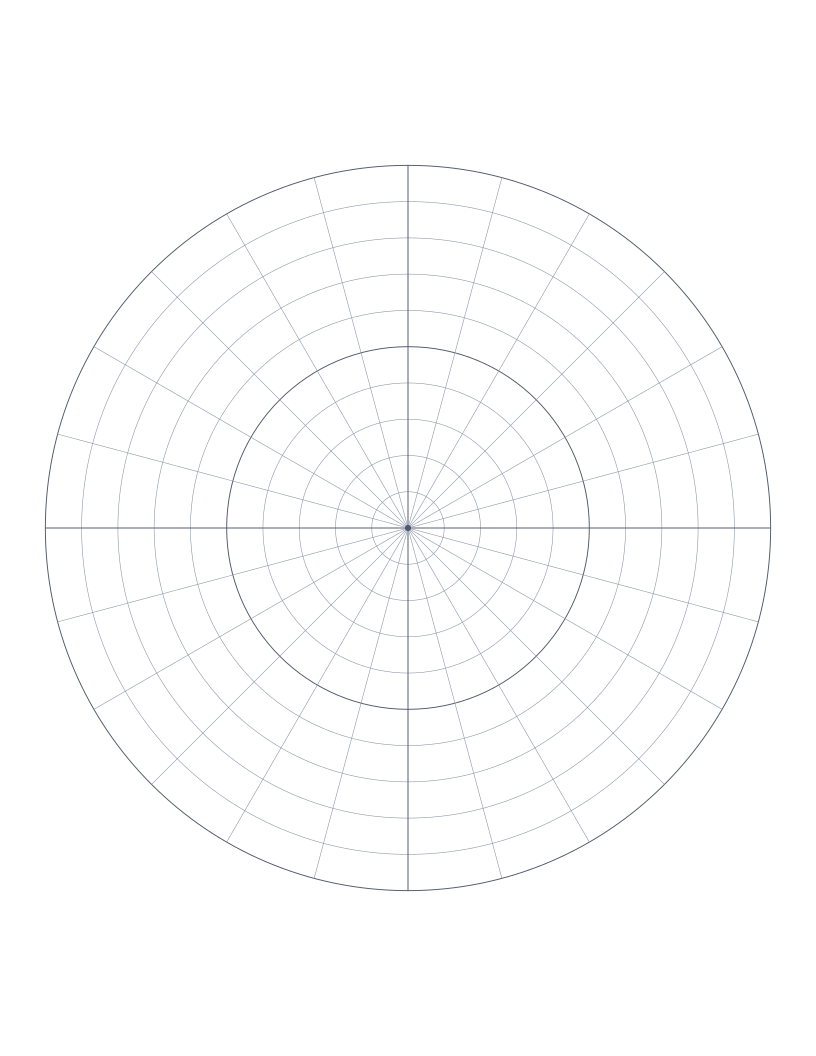
Polar Graph Paper
Concentric circles with radial spokes: for polar coordinates, vector diagrams and circular design.
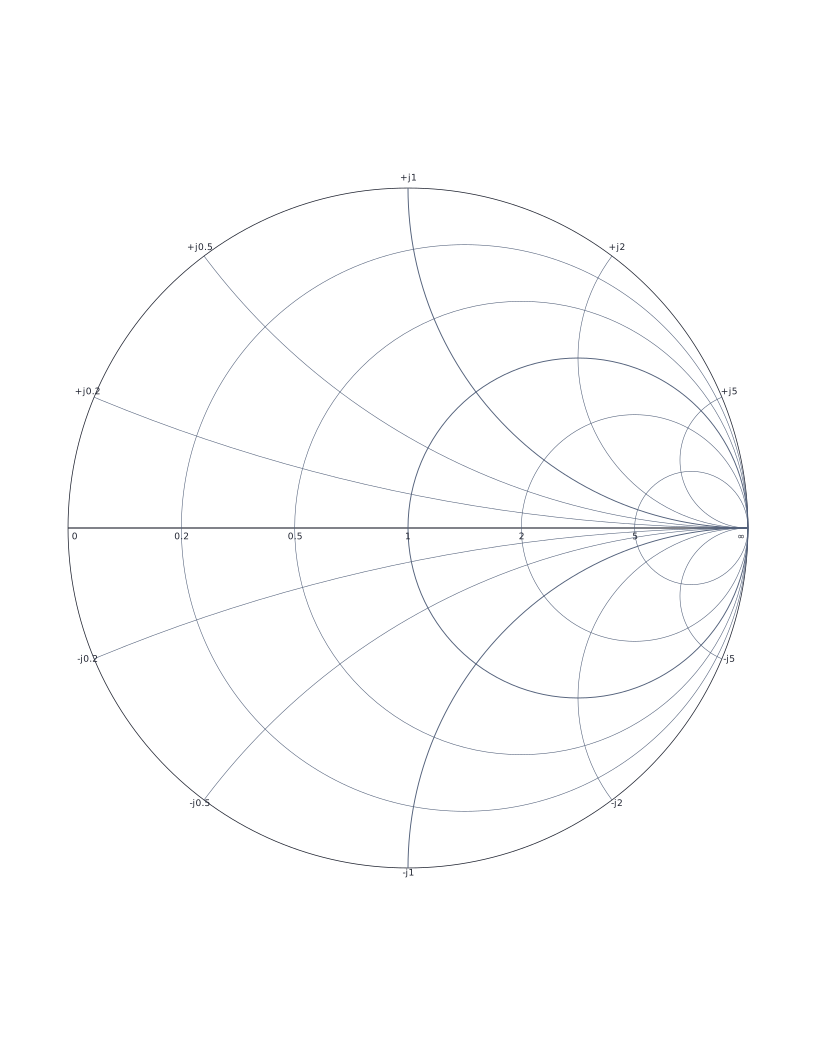
Smith Chart
Classic Smith chart for transmission line impedance matching and RF engineering.
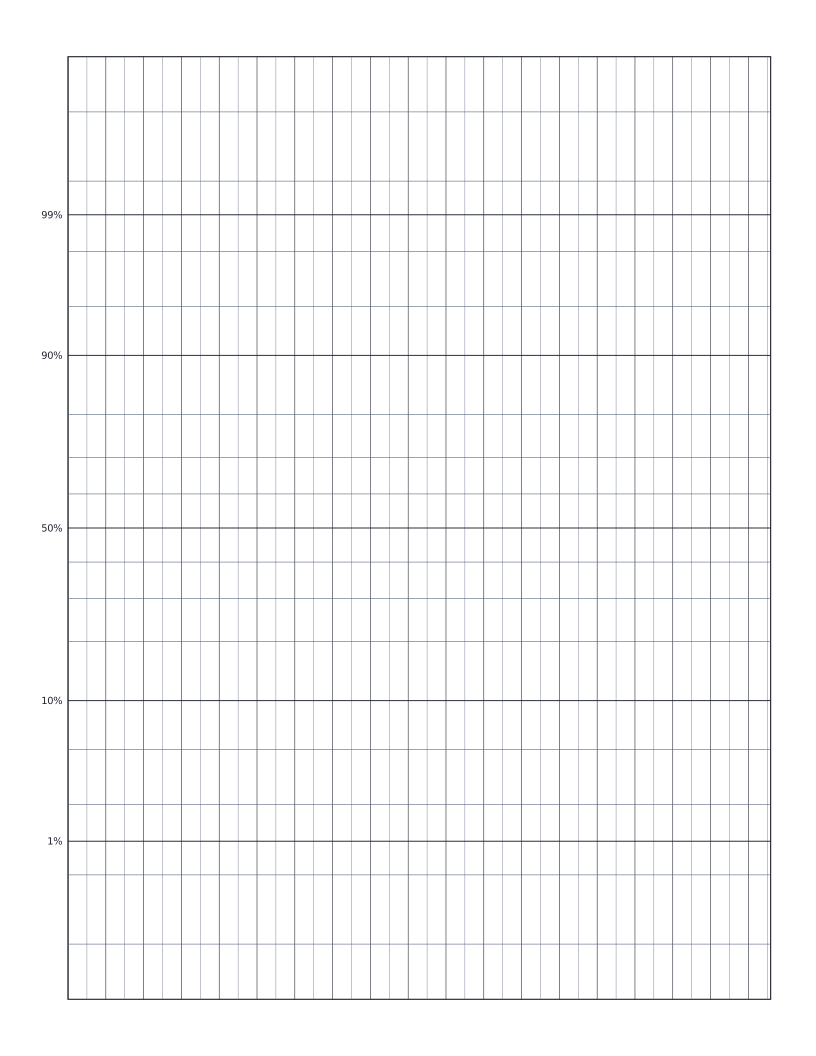
Normal Probability Paper
Normal probability paper: y-axis scaled by inverse normal CDF for plotting distribution data.
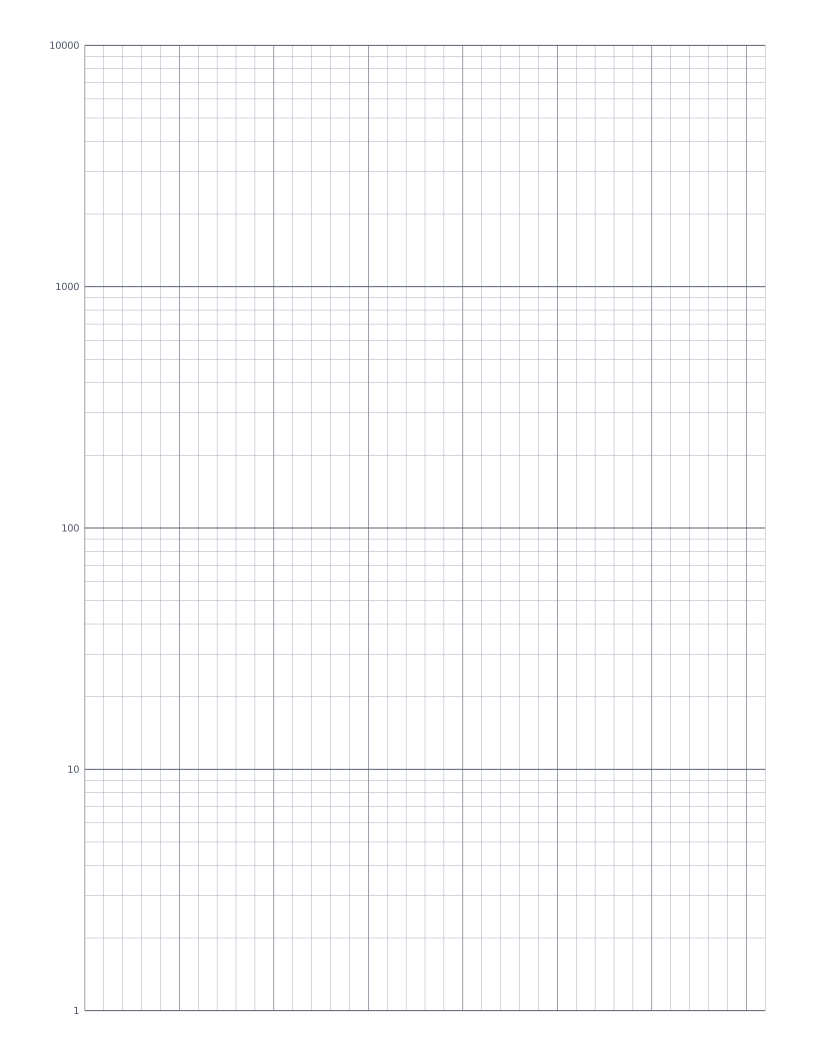
Semi-Log Graph Paper
Linear x-axis with a 4-decade logarithmic y-axis: the standard sheet for plotting exponentials and decay curves.
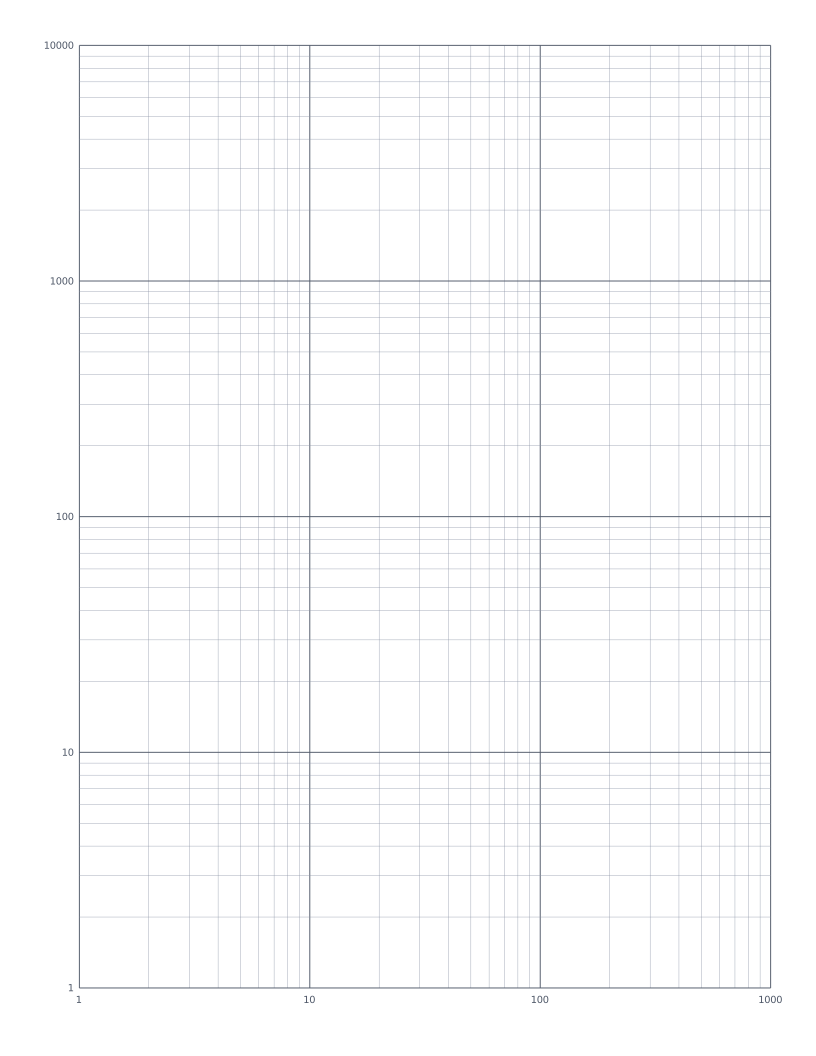
Log-Log Graph Paper
Both axes logarithmic: the standard sheet for plotting power laws and frequency-response curves.
Blank Periodic Table
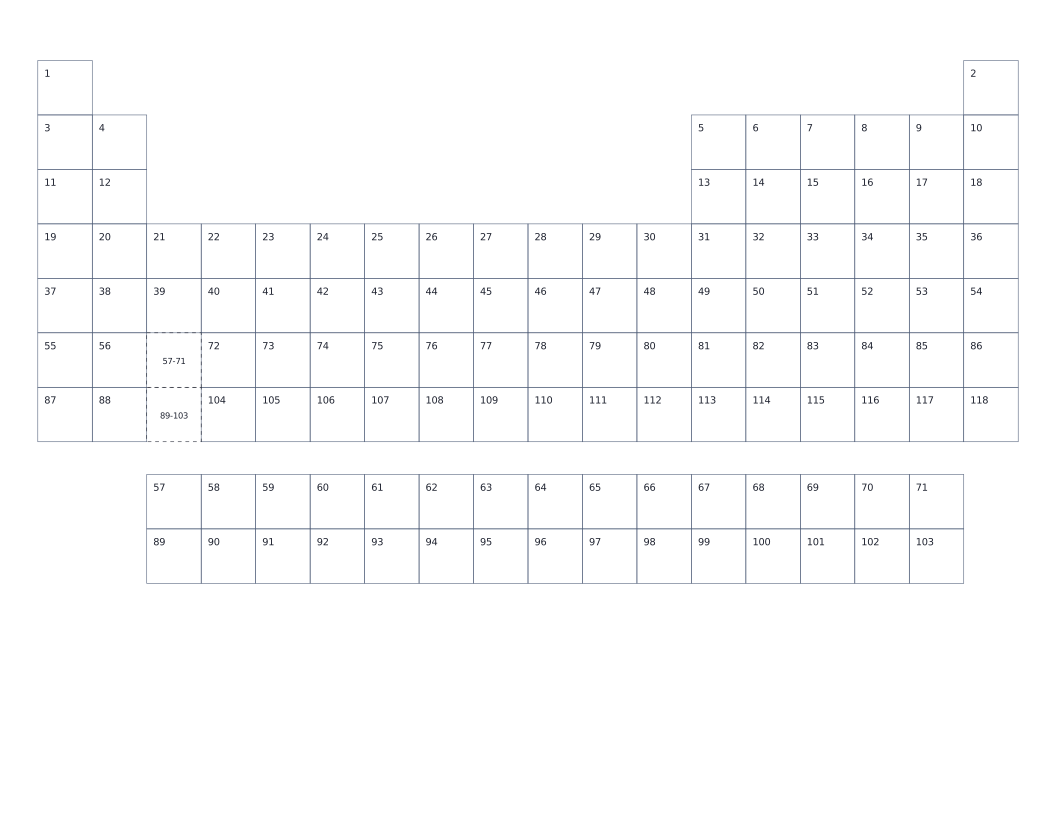
Blank periodic table with atomic numbers in each cell: fill in symbols, names and properties. Printed landscape so the 18-column table fills the page.
Ternary Plot Paper
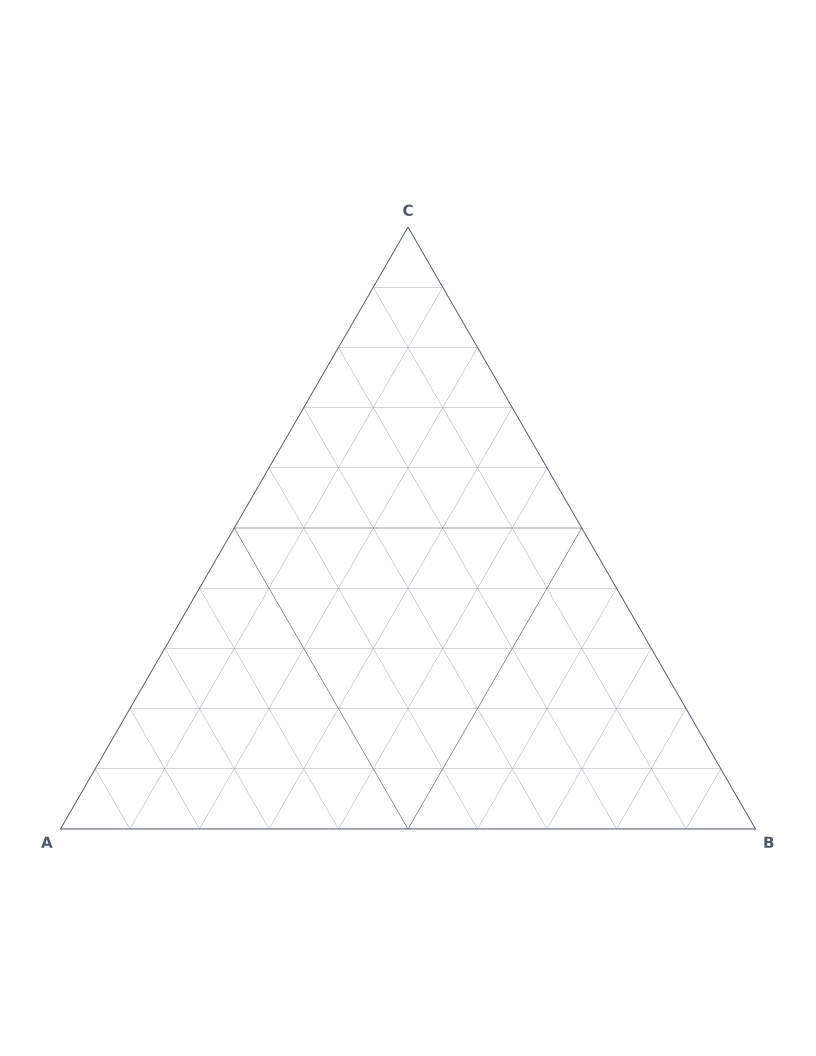
Equilateral triangle with three sets of grid lines: the standard format for plotting three-component compositions in chemistry, metallurgy and soil science.
Bode Plot Paper
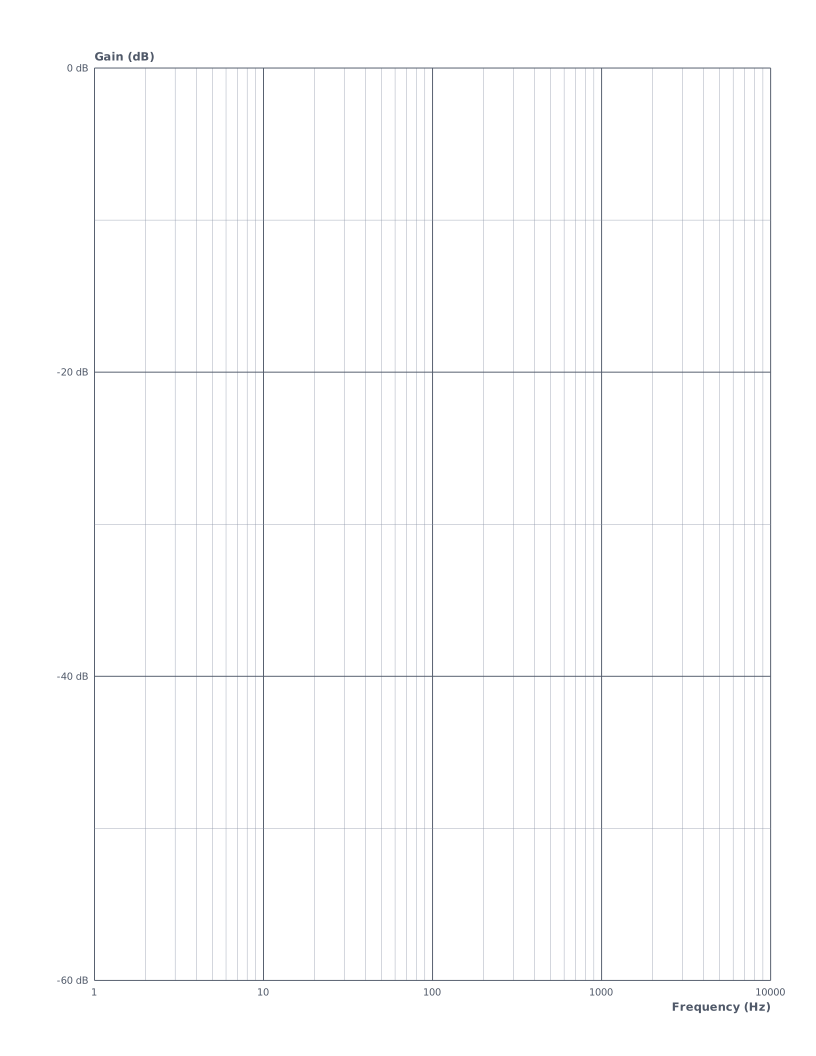
Log-frequency horizontal axis with linear gain (dB) vertical axis: the standard sheet for sketching frequency response.
Nyquist Plot Paper
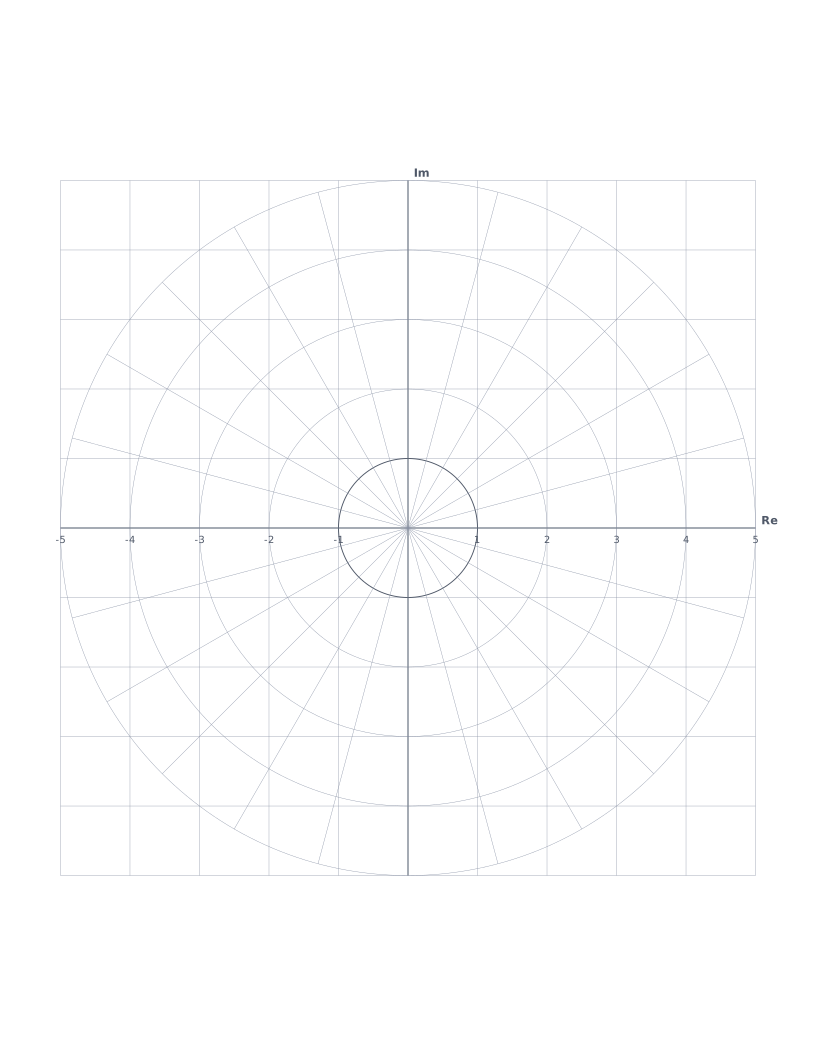
Complex plane with unit circle and radial phase lines: the standard format for plotting Nyquist contours and frequency response in control systems.
Which scientific template should I use?
Use semi-log paper when one variable grows or decays exponentially (it becomes a straight line). Use log-log paper for power laws. Bode plot paper combines a log frequency axis with linear decibels. Normal probability paper turns normally distributed data into a straight line, which is a quick visual test for normality.
- Polar Graph Paper: Concentric circles with radial spokes: for polar coordinates, vector diagrams and circular design.
- Smith Chart: Classic Smith chart for transmission line impedance matching and RF engineering.
- Normal Probability Paper: Normal probability paper: y-axis scaled by inverse normal CDF for plotting distribution data.
- Semi-Log Graph Paper: Linear x-axis with a 4-decade logarithmic y-axis: the standard sheet for plotting exponentials and decay curves.
- Log-Log Graph Paper: Both axes logarithmic: the standard sheet for plotting power laws and frequency-response curves.
- Blank Periodic Table: Blank periodic table with atomic numbers in each cell: fill in symbols, names and properties. Printed landscape so the 18-column table fills the page.
- Ternary Plot Paper: Equilateral triangle with three sets of grid lines: the standard format for plotting three-component compositions in chemistry, metallurgy and soil science.
- Bode Plot Paper: Log-frequency horizontal axis with linear gain (dB) vertical axis: the standard sheet for sketching frequency response.
- Nyquist Plot Paper: Complex plane with unit circle and radial phase lines: the standard format for plotting Nyquist contours and frequency response in control systems.
Printing tip: set your browser's scale to 100% (not "Fit to page") and margins to None, or use the Download button on any template for a PDF that prints at exact size.