Live preview · Letter (8.5" × 11") · Gray lines
First Quadrant Graph Paper
First quadrant graph paper shows only the part of the coordinate plane where x and y are both positive. The axes run along the left and bottom edges and every gridline is numbered from 0, so students can plot ordered pairs before they have met negative numbers.
Download saves a vector PDF in the size and color selected below, no print dialog needed.
Other formats:
Direct PDF:First Quadrant Graph Paper Letter PDFFirst Quadrant Graph Paper A4 PDF
Choose a different paper size:
Choose a different line color:
Great for
- Plotting ordered pairs in grades 4 to 6
- Line graphs and scatter plots of real data
- Distance-time and other science graphs
- Battleship-style coordinate games
First Quadrant Graph Paper at a glance
| What it is | Numbered coordinate grid showing only positive x and y, with axes on the left and bottom. |
|---|---|
| Category | Math & Learning |
| Paper sizes | Letter (8.5" × 11"), A4 (210 × 297 mm), A5 (148 × 210 mm), Half Letter (5.5" × 8.5"), B5 (176 × 250 mm), Legal (8.5" × 14"), 11" × 17", A3 (297 × 420 mm), A2 (420 × 594 mm), Poster (18" × 24"), Movie Poster (27" × 40") |
| Line colors | Faint, Light, Gray, Dark, Black, Blue, Green (default: Gray) |
| Format | Vector PDF at exact physical scale (Letter PDF, A4 PDF), PNG or SVG, or print directly from the browser |
| Price & license | Free. No signup or watermark. Printed sheets may be used for personal, classroom and commercial work. |
About first quadrant graph paper
The coordinate plane is divided into four quadrants by its two axes. The first quadrant is the top-right one, where both coordinates are positive. Most real-world data lives there: time, distance, height, cost and counts are rarely negative. That is why upper elementary math introduces graphing on a one-quadrant grid, and why most science graphs use it even at university. Putting the origin in the bottom-left corner uses the whole page for positive values instead of spending three quarters of it on quadrants the data never reaches. When students move on to negative coordinates, switch to the four-quadrant coordinate plane.
What's on the page
A grid of 8 mm squares with the x-axis along the bottom and the y-axis along the left, both drawn heavier than the grid. Every gridline is numbered, starting from 0 at the origin. Every fifth line is slightly darker to make counting easier. US Letter fits 23 units across and 31 up; A4 fits 22 across and 33 up. Axis titles are left blank so you can write your own variable names and units.
How to use it well
Across, then up
An ordered pair (x, y) means go x steps along the bottom axis first, then y steps up. Saying 'along the corridor, then up the stairs' helps younger students keep the order straight.
Rescale by writing over the numbers
If the data runs to 200, let each printed unit stand for 10 and write your own scale beside the printed numbers, or print in Faint and label by hand.
Title both axes with units
A graph without axis titles cannot be read by anyone else. Write the quantity and its unit, for example 'Time (s)' and 'Distance (m)', before plotting the first point.
Plot points on line crossings
Coordinates name the crossing points of gridlines, not the squares between them. Mark each point with a small cross exactly on the intersection.
Common mistakes to avoid
- Numbering the spaces instead of the lines. The numbers on this sheet sit under the gridlines, because coordinates measure distance from the axis.
- Swapping x and y. The point (3, 7) and the point (7, 3) are different places; the first number is always the horizontal one.
- Using it for data with negative values. Temperatures below zero or losses need the four-quadrant coordinate plane.
FAQ, First Quadrant Graph Paper
What is the first quadrant?+
It is the top-right quarter of the coordinate plane, where both the x and y coordinates are positive. By convention the quadrants are numbered counter-clockwise starting from it.
What grade uses first quadrant graph paper?+
In the US Common Core standards, plotting points in the first quadrant is a grade 5 topic, and all four quadrants are introduced in grade 6. Many curricula begin simple coordinate work in grade 4.
How many units does the grid show?+
On US Letter the x-axis runs from 0 to 23 and the y-axis from 0 to 31. On A4 it is 0 to 22 and 0 to 33. Larger paper sizes show more.
Is there a four-quadrant version?+
Yes. The coordinate plane has all four quadrants, and there is a 4-per-page worksheet version for homework problems.
Can I use it for a bar chart?+
Yes. Use the bottom axis for categories, giving each bar a width of one or two squares, and the left axis for the values.
Printing tips for best results+
- 1. Click Print above. A new tab opens the template at exact size.
- 2. The print dialog appears automatically. Set Scale to 100%. Never "Fit to page", which silently shrinks every cell.
- 3. Set Margins to None or Minimum so the grid reaches the page edge.
- 4. For a PDF, click Download instead. It generates a vector PDF directly without going through the printer driver.
More detail in the guide to printing graph paper at actual size. Need a spacing that isn’t listed? Use the graph paper generator.
You might also like
Math & Learning
10×10 Grid Paper
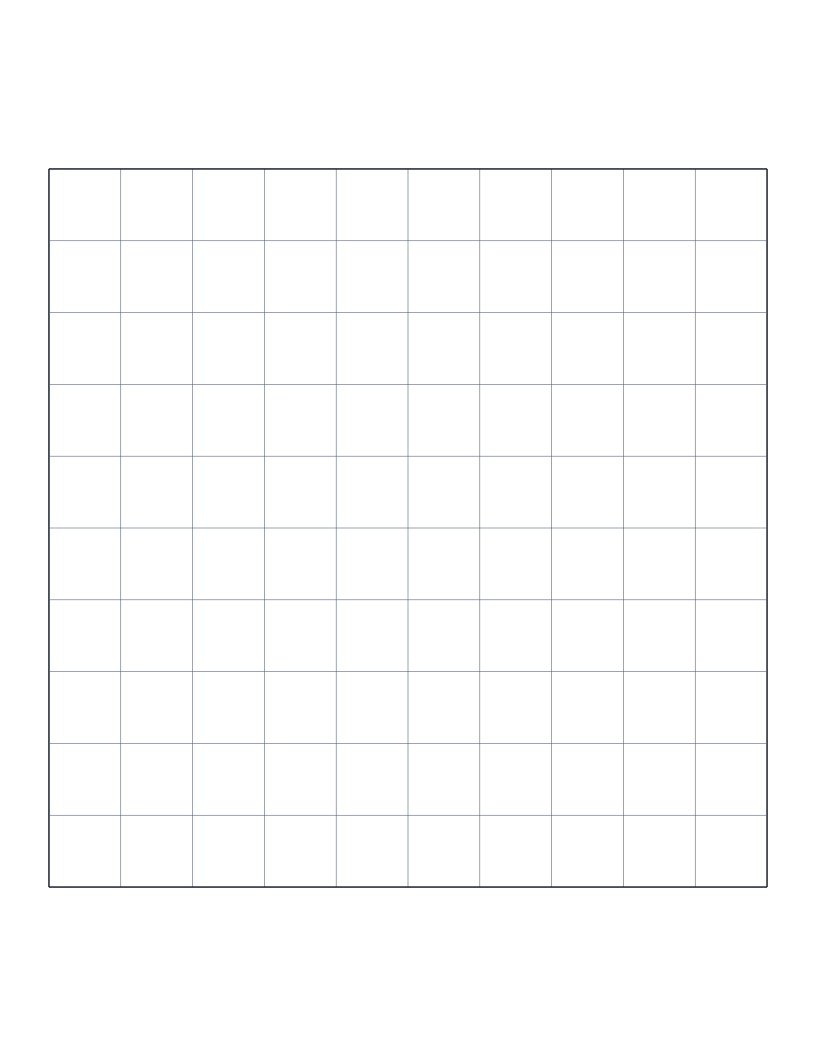
A single large 10 by 10 grid of 100 squares for percent, decimals and blank hundred charts.
Math & Learning
20×20 Grid Paper
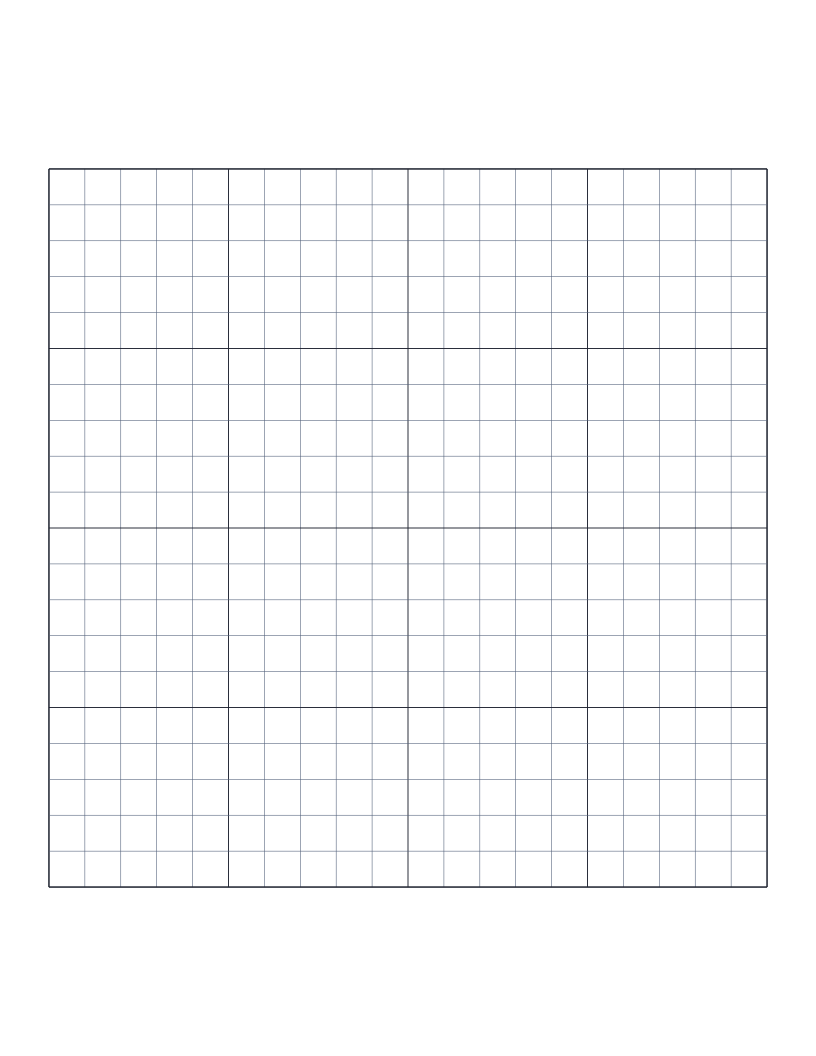
A single 20 by 20 grid of 400 squares with heavier lines every 5, for arrays, graphs and puzzles.
Math & Learning
Trigonometry Graph Paper
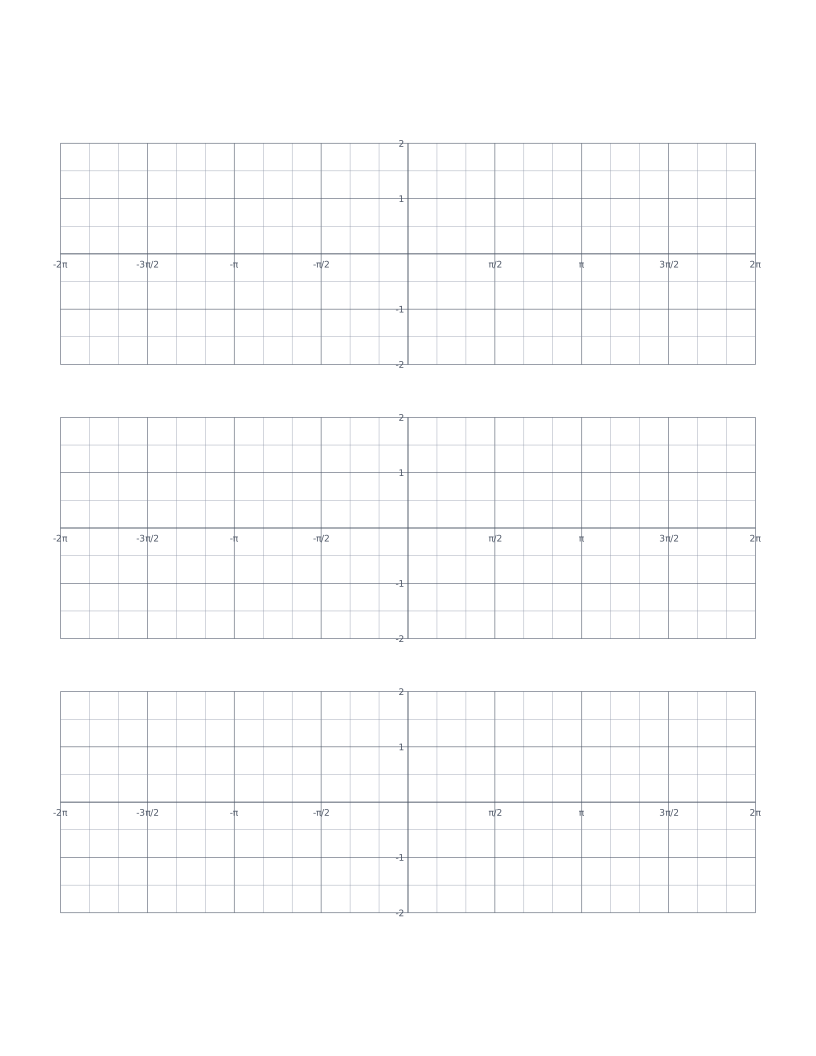
Axes marked in radians from -2π to 2π for graphing sine, cosine and tangent.
Math & Learning
Printable Ruler
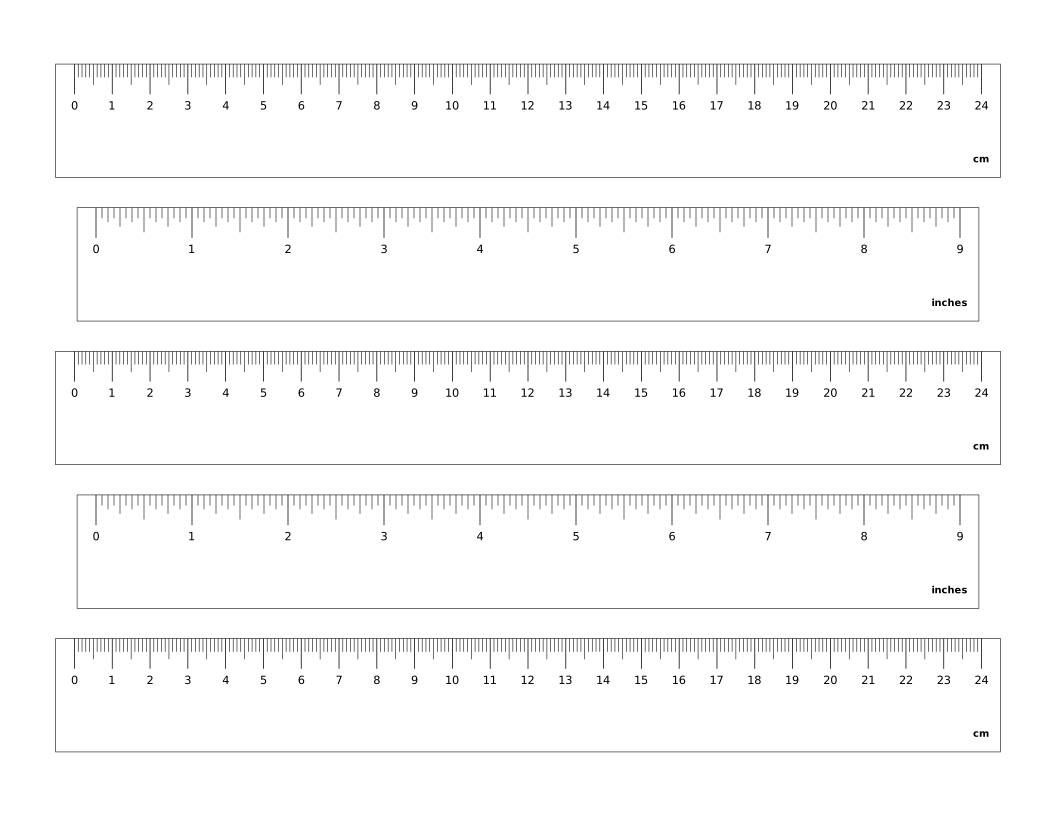
Cut-out paper rulers in centimeters and inches, accurate when printed at 100 percent.