Live preview · Letter (8.5" × 11") · Gray lines
Trigonometry Graph Paper
Trig graph paper has its horizontal axis marked in multiples of π instead of whole numbers. Each set of axes runs from -2π to 2π, which shows two full periods of sine or cosine, with the y-axis from -2 to 2.
Download saves a vector PDF in the size and color selected below, no print dialog needed.
Other formats:
Direct PDF:Trigonometry Graph Paper Letter PDFTrigonometry Graph Paper A4 PDF
Choose a different paper size:
Choose a different line color:
Great for
- Graphing sine, cosine and tangent
- Amplitude, period and phase shift exercises
- Sketching inverse and reciprocal trig functions
- Precalculus homework and test review
Trigonometry Graph Paper at a glance
| What it is | Axes marked in radians from -2π to 2π for graphing sine, cosine and tangent. |
|---|---|
| Category | Math & Learning |
| Paper sizes | Letter (8.5" × 11"), A4 (210 × 297 mm), A5 (148 × 210 mm), Half Letter (5.5" × 8.5"), B5 (176 × 250 mm), Legal (8.5" × 14"), 11" × 17", A3 (297 × 420 mm), A2 (420 × 594 mm), Poster (18" × 24"), Movie Poster (27" × 40") |
| Line colors | Faint, Light, Gray, Dark, Black, Blue, Green (default: Gray) |
| Format | Vector PDF at exact physical scale (Letter PDF, A4 PDF), PNG or SVG, or print directly from the browser |
| Price & license | Free. No signup or watermark. Printed sheets may be used for personal, classroom and commercial work. |
About trigonometry graph paper
Trigonometric functions repeat every 2π radians, and their key points fall at multiples of π/6, π/4 and π/2. On ordinary graph paper those values land at awkward decimals such as 1.57 and 3.14, so students spend more effort locating points than understanding the curve. Trig graph paper solves that by ruling the x-axis in fractions of π. The zeros, peaks and troughs of sin x and cos x then sit exactly on labelled gridlines. This template also keeps the two axes at the same scale: one radian along x is the same length as one unit along y. A sine wave drawn on it has its true proportions, with a slope of exactly 1 where it crosses the axis.
What's on the page
Several identical sets of axes stacked down the page: three on US Letter and four on A4. On each, the x-axis runs from -2π to 2π with a light gridline every π/6 and a darker, labelled line every π/2. The y-axis runs from -2 to 2 with light lines every 0.5 and darker, labelled lines at each whole number. Both axes are drawn heavier than the grid.
How to use it well
Plot the five key points
One period of sine or cosine is fixed by five points a quarter period apart: zero, maximum, zero, minimum, zero for sine. Mark them on the π/2 lines and join them with a smooth curve.
Use the π/6 lines for exact values
sin(π/6) is 0.5 and sin(π/3) is about 0.87. The light vertical lines at π/6 steps and the horizontal lines at 0.5 steps let you place these points precisely.
Draw asymptotes first for tangent
Tangent is undefined at π/2, 3π/2 and their negatives. Dash vertical lines there before sketching the branches between them.
Compare transformations on one axis
Draw y = sin x lightly, then y = 2 sin x or y = sin(x - π/2) in a second colour on the same axes to see the stretch or shift directly.
Common mistakes to avoid
- Graphing in degrees. The labels are radians. π corresponds to 180 degrees, π/2 to 90 degrees and each light gridline to 30 degrees.
- Joining points with straight lines. Sine and cosine curves are rounded at their peaks, not pointed.
- Plotting amplitudes above 2. The y-axis stops at 2 and -2; for larger amplitudes relabel the y-axis by hand or use the coordinate plane.
FAQ, Trigonometry Graph Paper
What is trig graph paper?+
Graph paper whose x-axis is scaled in multiples of π radians rather than whole numbers, so the important points of trigonometric functions fall on gridlines.
What range do the axes cover?+
x runs from -2π to 2π, which is two full periods of sine and cosine. y runs from -2 to 2.
Can I use it with degrees?+
Yes, by reading the labels as degrees: π/2 is 90°, π is 180°, 3π/2 is 270° and 2π is 360°. Each light vertical line is 30°.
Why is the grid wider than it is tall?+
Because the axes share one scale. Four π is about 12.57 units wide, while the y range of -2 to 2 is 4 units tall, so each graph is roughly three times as wide as it is high.
Is there a reference for exact trig values?+
Yes. The unit circle template marks the standard angles in degrees and radians.
Printing tips for best results+
- 1. Click Print above. A new tab opens the template at exact size.
- 2. The print dialog appears automatically. Set Scale to 100%. Never "Fit to page", which silently shrinks every cell.
- 3. Set Margins to None or Minimum so the grid reaches the page edge.
- 4. For a PDF, click Download instead. It generates a vector PDF directly without going through the printer driver.
More detail in the guide to printing graph paper at actual size. Need a spacing that isn’t listed? Use the graph paper generator.
You might also like
Math & Learning
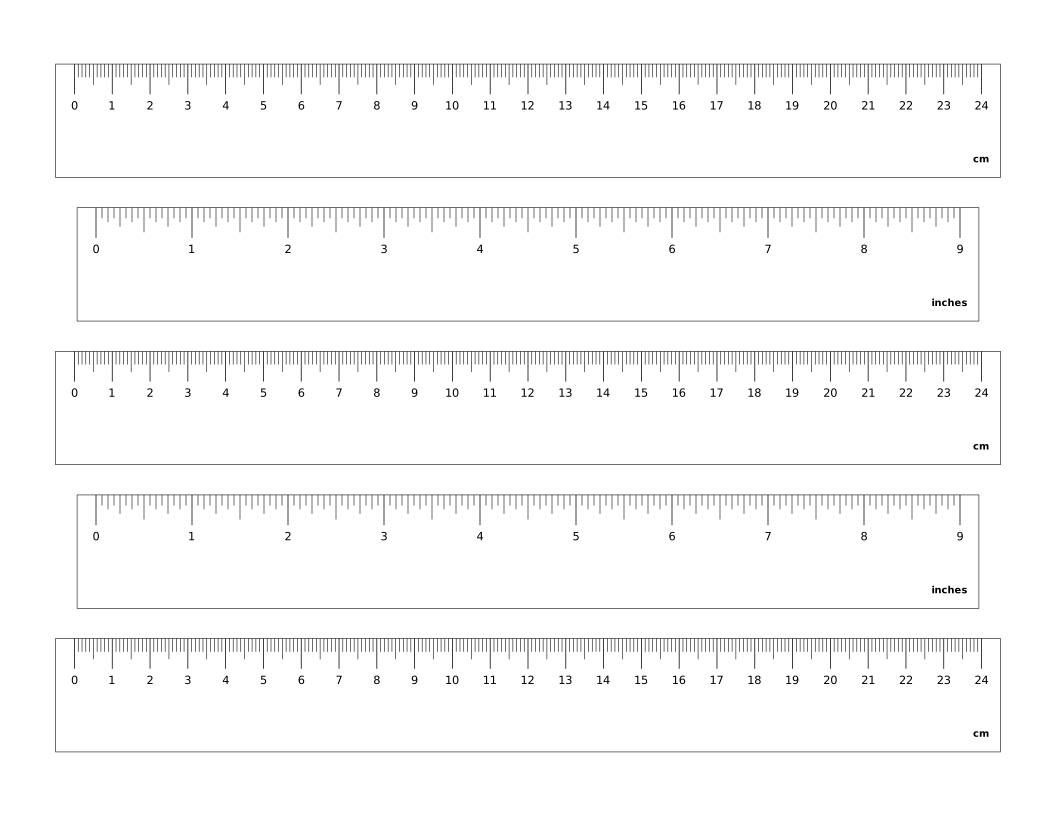
Printable Ruler
Cut-out paper rulers in centimeters and inches, accurate when printed at 100 percent.
Math & Learning
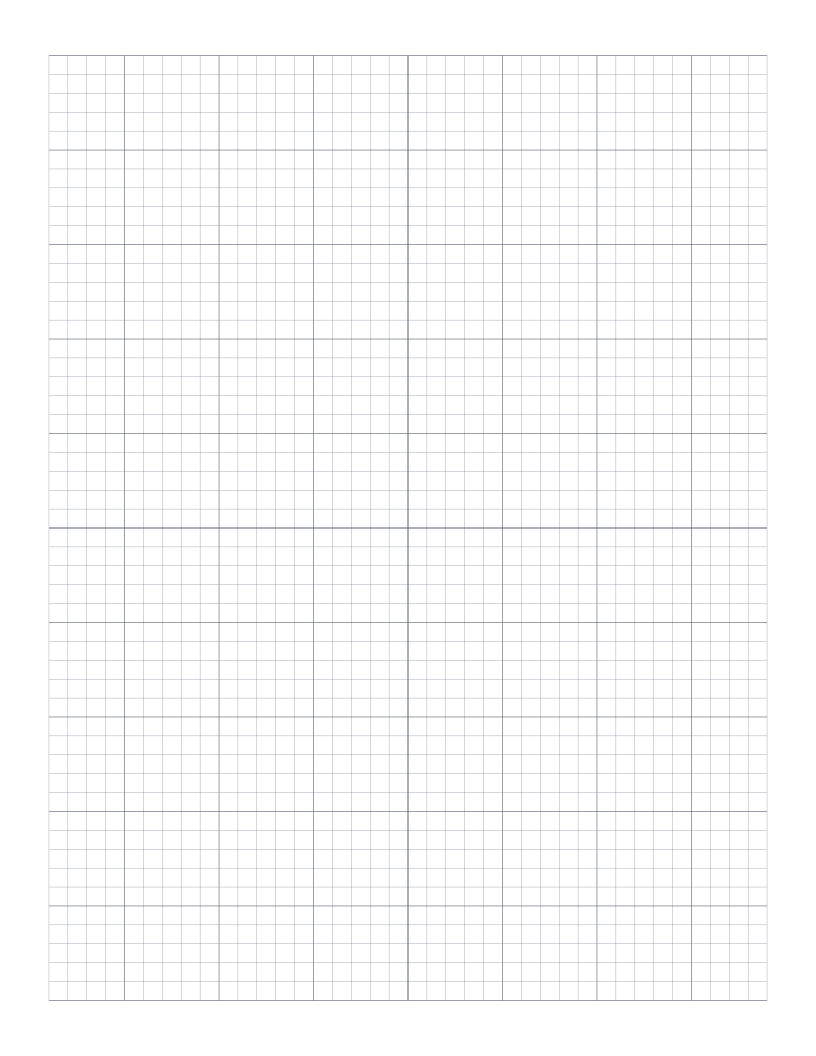
Blank Coordinate Plane
Four-quadrant coordinate plane with axes but no numbers, so you set the scale.
Math & Learning
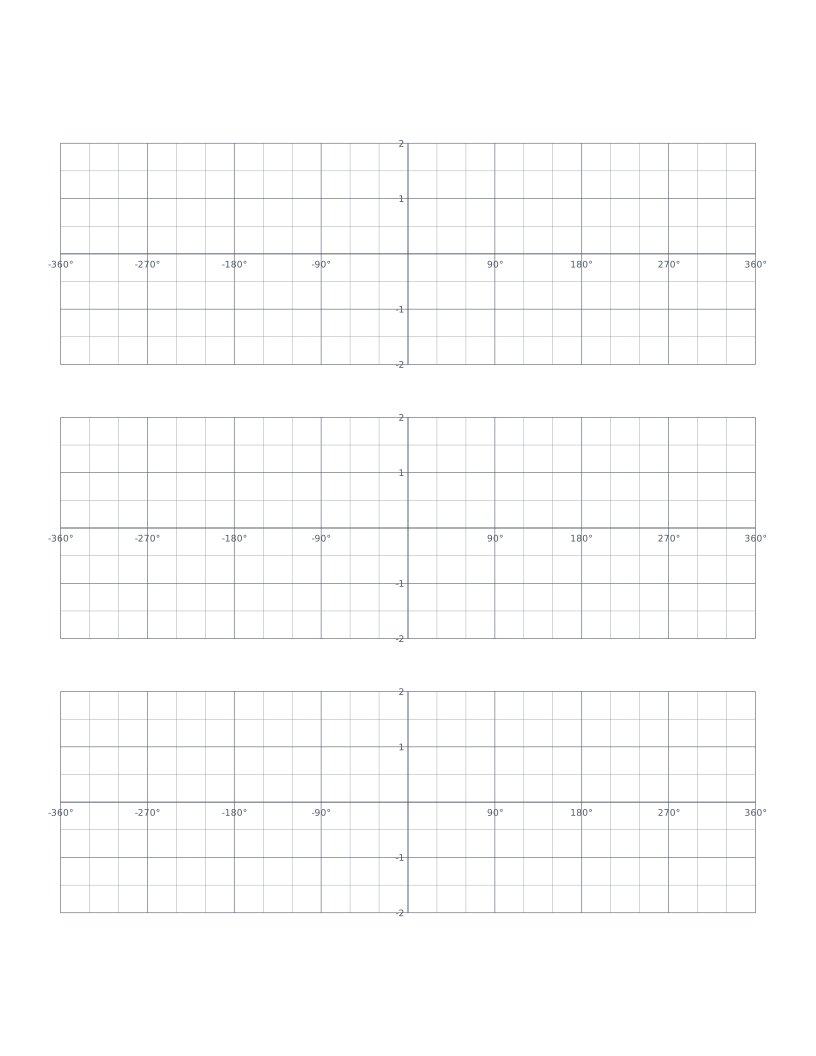
Trigonometry Graph Paper (Degrees)
Axes marked in degrees from -360° to 360° for graphing sine, cosine and tangent.
Math & Learning
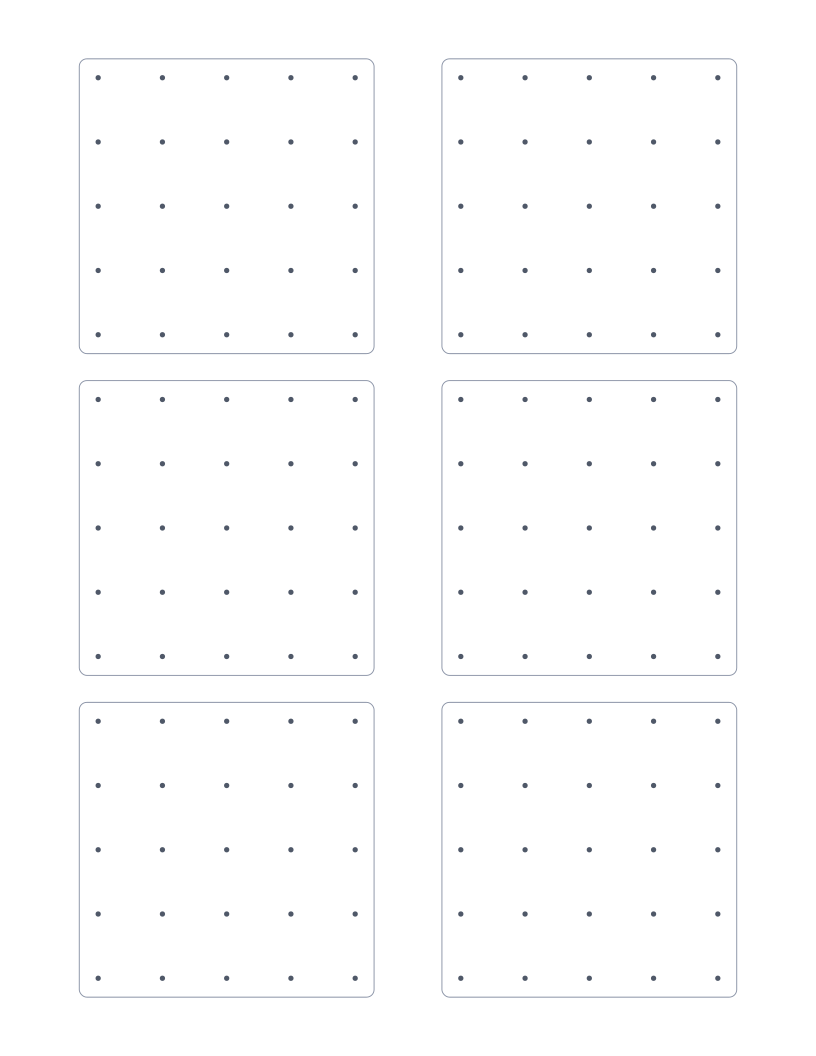
Geoboard Paper (5×5)
Six 5×5 geoboard templates per page for recording shapes made with rubber bands.