Live preview · Letter (8.5" × 11") · Gray lines
Coordinate Planes (4 per Page)
Four small coordinate planes on a single page, each running from -10 to 10 on both axes with numbered ticks and a problem number. It's the layout teachers use for graphing homework and quizzes: four problems, four graphs, one sheet.
Download generates a crisp vector PDF directly, no print dialog needed.
Choose a different paper size:
Choose a different line color:
Great for
- Graphing linear equations and inequalities
- Plotting points and identifying quadrants
- Transformations: translations, reflections and rotations
- Quizzes, exit tickets and homework sets
Coordinate Planes (4 per Page) at a glance
| What it is | Four numbered coordinate planes on one page, each from -10 to 10: the classic graphing worksheet for algebra homework and quizzes. |
|---|---|
| Category | Math & Learning |
| Paper sizes | Letter (8.5" × 11"), A4 (210 × 297 mm), 11" × 17", Legal (8.5" × 14"), A3 (297 × 420 mm), A2 (420 × 594 mm), Poster (18" × 24"), Movie Poster (27" × 40") |
| Line colors | Faint, Light, Gray, Dark, Black, Blue, Green (default: Gray) |
| Format | Vector PDF download at exact physical scale, or print directly from the browser |
| Price & license | Free. No signup or watermark. Printed sheets may be used for personal, classroom and commercial work. |
About coordinate planes (4 per page)
A full-page coordinate plane is ideal when one graph needs room, but most algebra practice involves several short graphing problems: graph y = 2x + 1, plot these four points, reflect this triangle in the y-axis. Giving each of those a whole sheet wastes paper and makes homework bulky. The four-per-page layout solves that with smaller planes that still cover the -10 to 10 range most textbook problems use. Each plane is numbered so students can match graphs to questions, and the axes are labelled every two units so values can be read quickly without crowding the grid. Four planes per sheet also make good warm-ups and exit tickets: four quick graphing questions that students can finish in a few minutes and teachers can check at a glance.
What's on the page
Four coordinate planes arranged two by two, each numbered 1 to 4 in its top-left corner. Every plane spans -10 to 10 on both axes with bold axes through the origin, heavier gridlines every five units, and tick labels every two units. On Letter and A4 each grid cell is 4 mm, making each plane 8 cm square; larger paper sizes use larger cells.
How to use it well
Write the equation beside each number
Copy the problem next to its plane number before graphing. When you check the work later, each graph has its question right beside it.
Plot three points for every line
Two points define a line, but a third catches arithmetic mistakes: if the three don't line up, one of them is wrong.
Use the bold lines to count
The heavier gridlines at ±5 and ±10 let you find values like 7 or -8 by counting from the nearest bold line instead of from the origin.
Label every graph
Write the equation along the line or near the plotted shape. Unlabelled graphs are the most common reason students lose marks on otherwise correct work.
Common mistakes to avoid
- Graphing values outside the range. Each plane runs from -10 to 10. For problems with larger values, change the scale (one cell = 2 or 5 units) and write it on the axes, or use the full-page coordinate plane.
- Mixing up x and y. Points are written (x, y): move across first, then up or down. Plotting (3, -2) at (-2, 3) is the most common graphing error.
- Drawing lines that stop at the last plotted point. A line extends to the edge of the grid; add arrowheads to show it continues.
FAQ, Coordinate Planes (4 per Page)
What range does each graph cover?+
-10 to 10 on both axes, with labels every two units and heavier lines every five. That covers most algebra textbook graphing problems.
How big are the squares?+
4 mm on Letter and A4, so each plane is 8 cm across. On 11 × 17 and A3 the cells grow to 5.5 mm so the planes fill the larger page.
Can I get one large coordinate plane instead?+
Yes. The full-page coordinate plane template gives a single large grid with a 5 mm cell, for graphs that need more room or more precision.
Is this good for transformations?+
Yes. Plot the original shape in one plane and its image in another, or both in the same plane in different colours. Four planes let a student show a sequence of transformations step by step.
Can I use it for inequalities?+
Yes. Graph the boundary line, dashed for < or > and solid for ≤ or ≥, then shade the side that satisfies the inequality.
How do I graph a line from its equation?+
For y = mx + b, plot the y-intercept (0, b), then use the slope m as rise over run to find more points. For y = 2x + 1, start at (0, 1) and move up 2 and right 1 to reach (1, 3).
Printing tips for best results+
- 1. Click Print above. A new tab opens the template at exact size.
- 2. The print dialog appears automatically. Set Scale to 100%. Never "Fit to page", which silently shrinks every cell.
- 3. Set Margins to None or Minimum so the grid reaches the page edge.
- 4. For a PDF, click Download instead. It generates a vector PDF directly without going through the printer driver.
You might also like
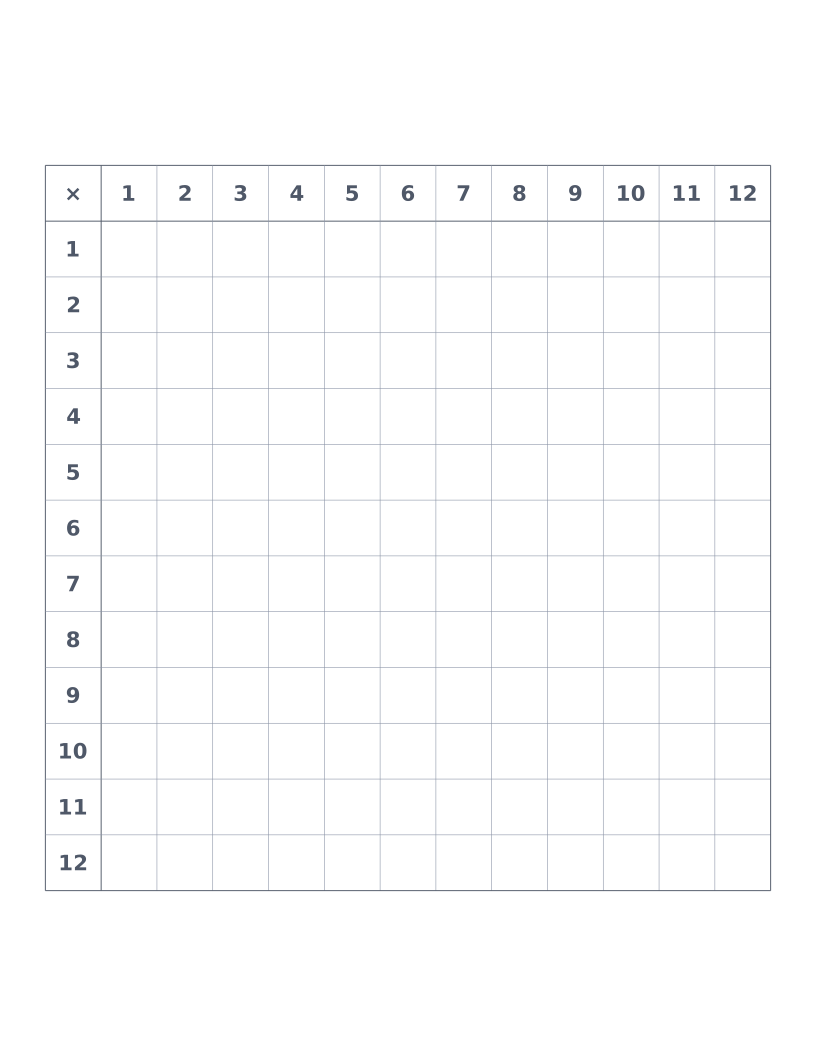
Blank Multiplication Table (12×12)
A 12×12 multiplication grid with the factors printed and the products left blank, for times-table practice and quizzes.
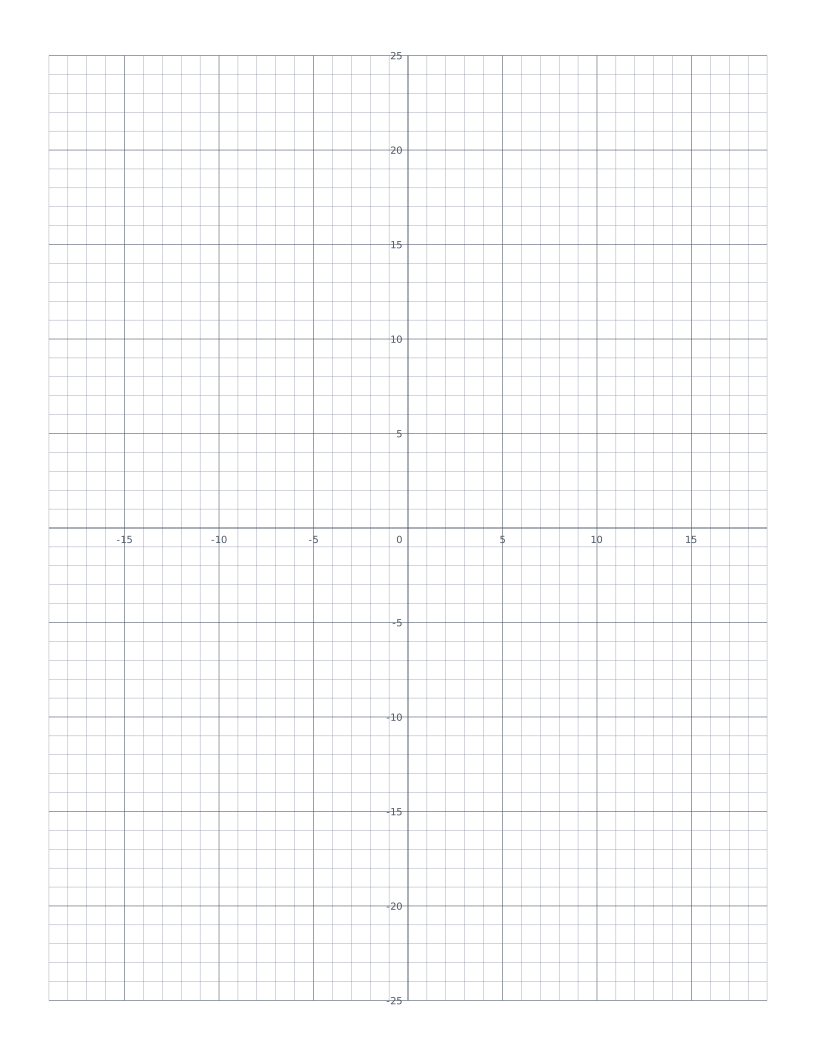
Coordinate Plane
Cartesian grid with numbered x and y axes through the centre: four quadrants for plotting points and graphing functions.
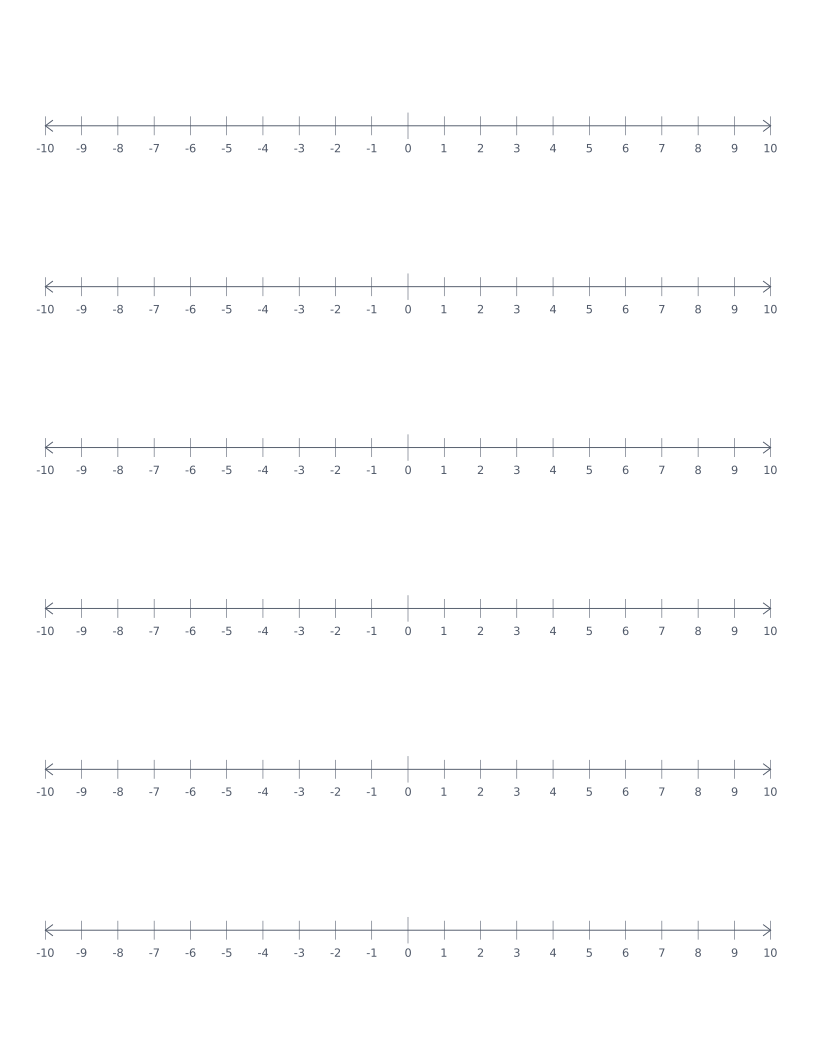
Number Line
Stacked number lines from -10 to 10: for elementary math, addition, subtraction and integer practice.
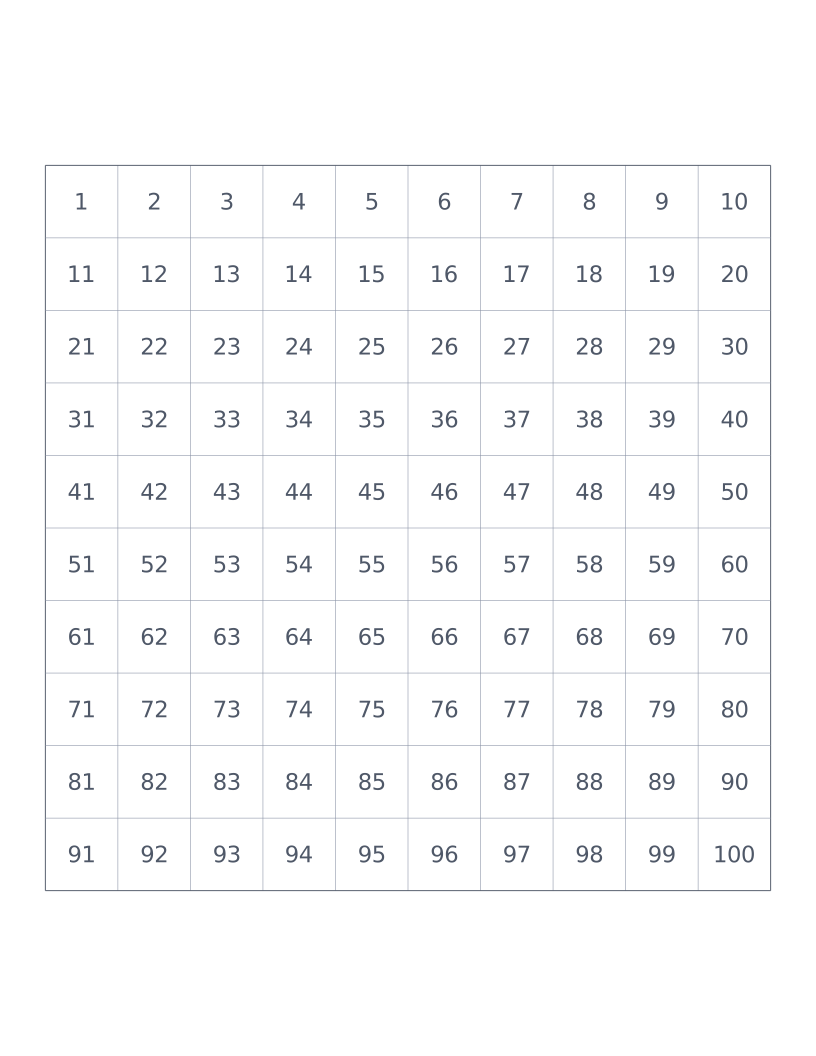
Hundreds Chart
10×10 grid numbered 1 to 100: a classroom staple for counting, place value and skip-counting.