Live preview · Letter (8.5" × 11") · Gray lines
Polar Graph Paper (Degrees)
Polar graph paper with the angles written around the edge in degrees. Ten concentric circles give the distance from the centre and radial lines every 15° give the direction.
Download saves a vector PDF in the size and color selected below, no print dialog needed.
Other formats:
Direct PDF:Polar Graph Paper (Degrees) Letter PDFPolar Graph Paper (Degrees) A4 PDF
Choose a different paper size:
Choose a different line color:
Great for
- Plotting polar curves such as roses and cardioids
- Bearings, navigation and radar plots
- Antenna and microphone pickup patterns
- Radial designs and mandalas
Polar Graph Paper (Degrees) at a glance
| What it is | Polar coordinate paper with radial lines every 15° and angles labelled in degrees. |
|---|---|
| Category | Scientific |
| Paper sizes | Letter (8.5" × 11"), A4 (210 × 297 mm), A5 (148 × 210 mm), Half Letter (5.5" × 8.5"), B5 (176 × 250 mm), Legal (8.5" × 14"), 11" × 17", A3 (297 × 420 mm), A2 (420 × 594 mm), Poster (18" × 24"), Movie Poster (27" × 40") |
| Line colors | Faint, Light, Gray, Dark, Black, Blue, Green (default: Gray) |
| Format | Vector PDF at exact physical scale (Letter PDF, A4 PDF), PNG or SVG, or print directly from the browser |
| Price & license | Free. No signup or watermark. Printed sheets may be used for personal, classroom and commercial work. |
About polar graph paper (degrees)
In polar coordinates a point is located by its distance r from the origin and its angle θ from the positive x-axis, measured counter-clockwise. Labelled paper saves counting radial lines to find an angle. This sheet is labelled at the standard angles: every 30° and at 45°, 135°, 225° and 315°. For the same grid without labels, see polar graph paper.
What's on the page
Ten evenly spaced circles, with the fifth and tenth heavier, and 24 radial lines 15° apart, with the four axis directions heavier. Degree labels sit just outside the outer circle, starting from 0° on the right and increasing counter-clockwise.
How to use it well
Pick a radius scale
Decide what each circle is worth so the largest r value reaches the outer ring, and write it on the page.
Make a table first
List r for θ = 0°, 15°, 30° and so on, then plot each point where its circle meets its radial line.
Handle negative r
A negative r is plotted in the opposite direction: add 180° to the angle and use the positive distance.
Common mistakes to avoid
- Measuring angles clockwise. Mathematical convention is counter-clockwise from the right. Compass bearings go clockwise from north, so relabel if you are plotting bearings.
- Joining points with straight lines. Polar curves are smooth.
FAQ, Polar Graph Paper (Degrees)
How far apart are the radial lines?+
15 degrees. There are 24 in the full circle.
Is there a radian version?+
Which direction is 0°?+
To the right, along the positive x-axis. Angles increase counter-clockwise.
Can I use it for compass bearings?+
Yes, but write your own labels with 0° at the top and angles increasing clockwise.
Printing tips for best results+
- 1. Click Print above. A new tab opens the template at exact size.
- 2. The print dialog appears automatically. Set Scale to 100%. Never "Fit to page", which silently shrinks every cell.
- 3. Set Margins to None or Minimum so the grid reaches the page edge.
- 4. For a PDF, click Download instead. It generates a vector PDF directly without going through the printer driver.
More detail in the guide to printing graph paper at actual size. Need a spacing that isn’t listed? Use the graph paper generator.
You might also like
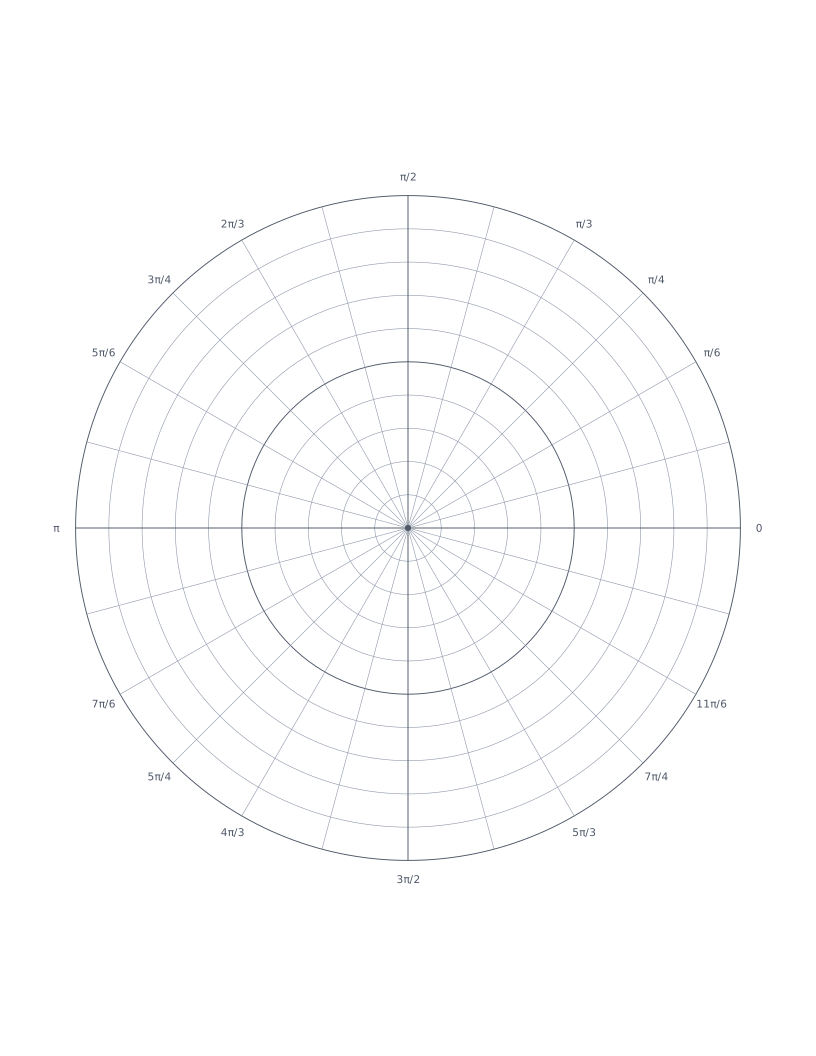
Scientific
Polar Graph Paper (Radians)
Polar coordinate paper with radial lines every π/12 and angles labelled in radians.
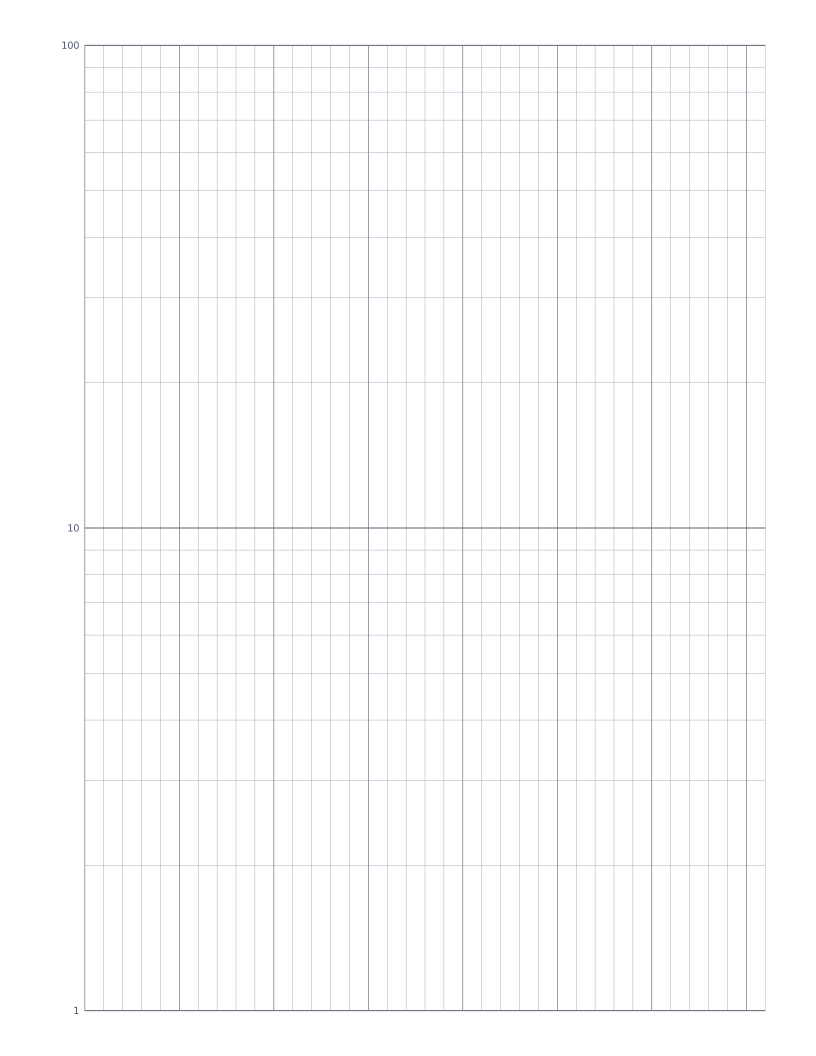
Scientific
Semi-Log Graph Paper (2 Cycle)
Semi-logarithmic paper with two cycles on the vertical axis, covering a 100-fold range.
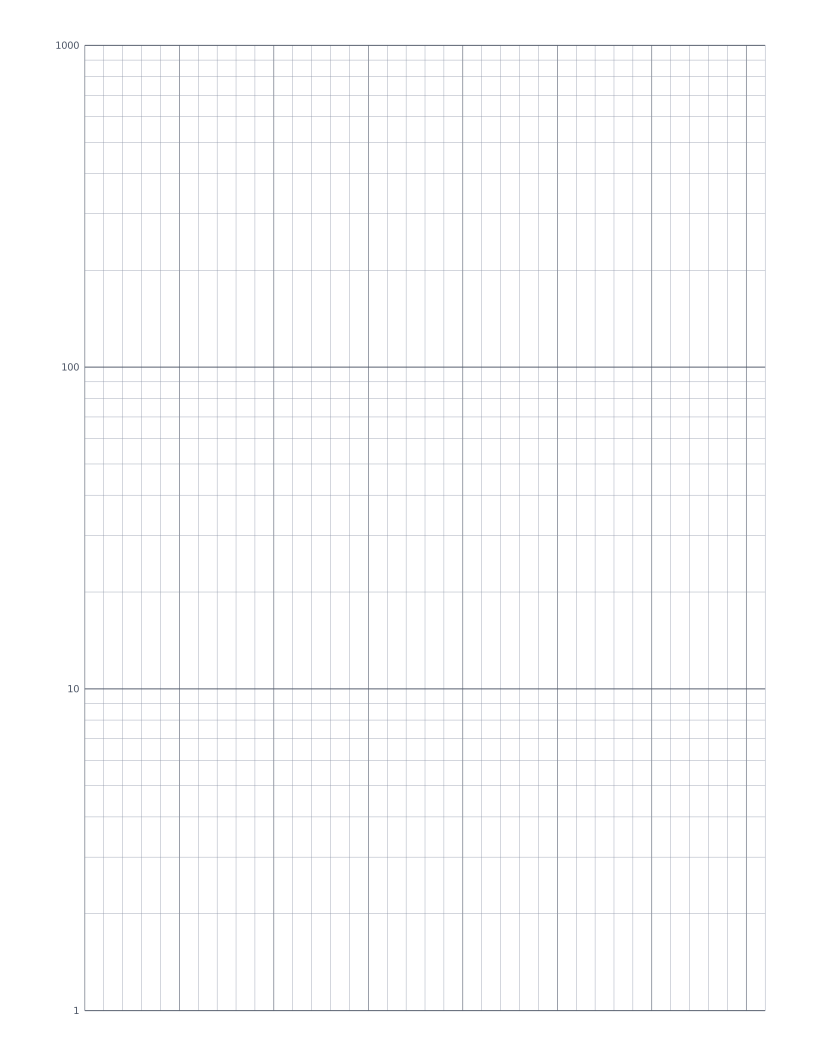
Scientific
Semi-Log Graph Paper (3 Cycle)
Semi-logarithmic paper with three cycles on the vertical axis, covering a 1000-fold range.
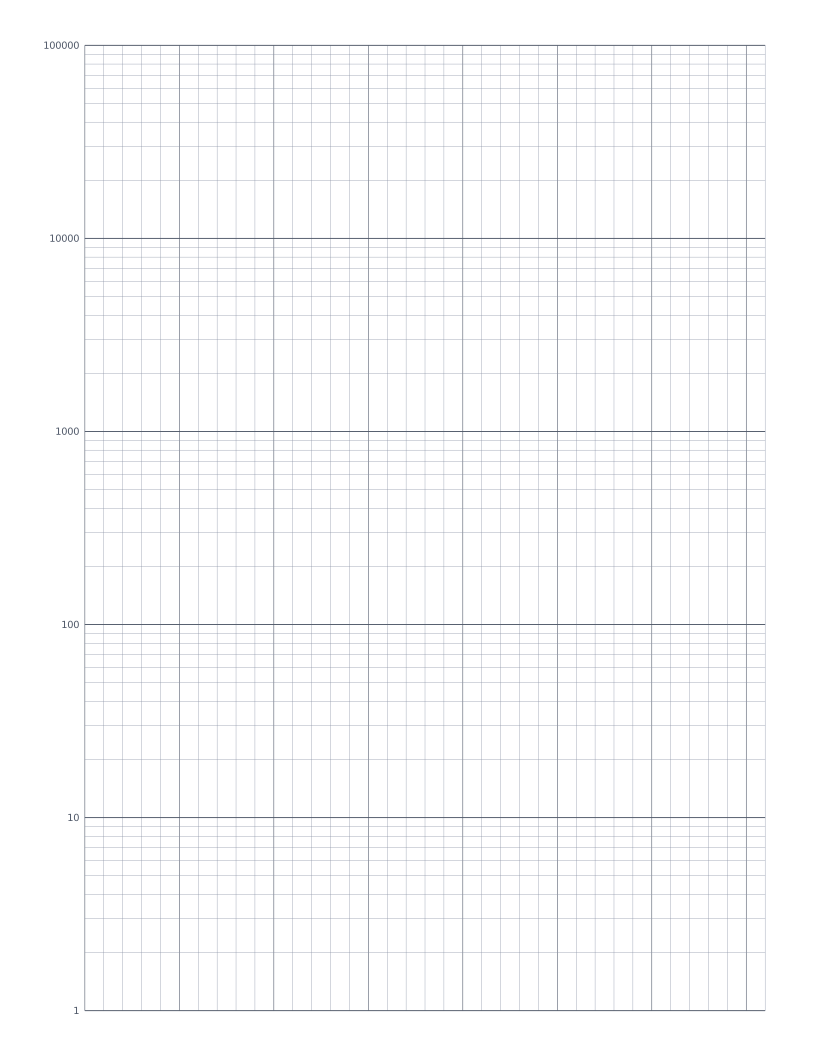
Scientific
Semi-Log Graph Paper (5 Cycle)
Semi-logarithmic paper with five cycles, for data spanning a 100,000-fold range.