Live preview · Letter (8.5" × 11") · Dark lines
Place Value Chart
A place value chart covering ones through millions, with three decimal places below the decimal point. Columns are grouped into periods (ones, thousands, millions) with bold dividers between groups — the same visual convention used by every textbook and standardised test in US elementary math.
Download generates a crisp vector PDF directly, no print dialog needed.
Choose a different paper size:
Choose a different line color:
Great for
- Teaching the structure of multi-digit numbers (K–5 math)
- Comparing and ordering large numbers
- Writing and reading decimal numbers
- Place value worksheets and homework
Place Value Chart at a glance
| What it is | Standard place value chart through millions with optional decimals: groups columns by period (ones, thousands, millions) for clear reading. |
|---|---|
| Category | Math & Learning |
| Paper sizes | Letter (8.5" × 11"), A4 (210 × 297 mm), 11" × 17", Legal (8.5" × 14"), A3 (297 × 420 mm), A2 (420 × 594 mm), Poster (18" × 24"), Movie Poster (27" × 40") |
| Line colors | Faint, Light, Gray, Dark, Black, Blue, Green (default: Dark) |
| Format | Vector PDF download at exact physical scale, or print directly from the browser |
| Price & license | Free. No signup or watermark. Printed sheets may be used for personal, classroom and commercial work. |
About place value chart
The place value chart is the canonical visual representation of how base-10 number notation works. Each column represents a different power of ten — ones, tens, hundreds, thousands, and so on — and any natural number can be written by placing its digits in the appropriate columns. The columns are conventionally grouped into 'periods' of three (ones, thousands, millions, billions), which mirrors the standard practice of using commas as thousands separators when writing large numbers. This grouping isn't just visual decoration: it's how speakers of English actually read numbers aloud. '3,456,789' is read as 'three million, four hundred fifty-six thousand, seven hundred eighty-nine' — three periods, each pronounced separately. The chart makes that pronunciation pattern explicit by drawing bold lines between periods and labelling each group. For decimal numbers, the chart extends to the right of the ones column with tenths, hundredths, thousandths, separated from the whole-number side by a heavier dashed line representing the decimal point. The whole structure is one of the most teachable visualisations in elementary math because it makes the abstract idea of place value into a concrete spatial layout that students can fill in by hand.
What's on the page
Three periods (Millions, Thousands, Ones) shown as bordered groups across the top of the page, with three subcolumns each (Hundreds / Tens / Ones — abbreviated 'H / T / O' under each period name). To the right of the Ones period, a Decimals section shows three more columns (tenths, hundredths, thousandths — abbreviated 't / h / th'), separated from the whole-number side by a dashed vertical line representing the decimal point. Below the headers, twelve blank rows let students write multiple numbers, one per row. The first column shows tens of millions; rows from 1 to 12 give plenty of room for an exercise set.
How to use it well
Read across periods, not digit-by-digit
The chart's purpose is to make the period structure visible. When reading a number like 3,456,789, read it as '3 million, 456 thousand, 789' — period by period. Reading digit-by-digit ('three-four-five-six-seven-eight-nine') is the mistake the chart is designed to prevent.
Use the decimal column for money
Dollar amounts are place-value exercises in disguise. $1,234.56 is one thousand two hundred thirty-four dollars and fifty-six cents — three places left of the decimal, two places right. Filling in the chart for monetary amounts is a quick way to make the abstract chart feel useful.
Compare numbers column-by-column
To compare two numbers, write them in the chart on stacked rows and compare column-by-column from left (most significant) to right. The first column where they differ tells you which is larger. This is faster and less error-prone than mentally aligning them.
Don't forget the zero placeholders
Numbers like 3,005,007 need zeros in the empty columns to preserve place value. The chart makes this obvious: every column gets a digit, even if it's zero. Students who skip zeros end up writing 3,57 (or worse) — the chart is the antidote.
Common mistakes to avoid
- Confusing place value with face value. The digit 3 in 30 has a face value of 3 but a place value of thirty. The chart shows the place; the digit shows the face value. Students who conflate the two get systematic errors throughout elementary arithmetic.
- Aligning decimals by the wrong column. When writing decimal numbers on the chart, align by the decimal point, not by the leftmost digit. The chart's dashed decimal line is there to enforce this alignment.
- Reading decimals as a separate number. 0.234 isn't 'point two hundred thirty-four', it's 'two hundred thirty-four thousandths' (because the last digit sits in the thousandths column). The chart makes this clear by labelling the columns — students who skip the column names misread decimals.
FAQ, Place Value Chart
Why are the columns grouped in threes?+
Because that's how English-speakers (and most Indo-European language speakers) read numbers: in groups of three with names ending in -thousand, -million, -billion. The commas that separate periods in written numbers are the same groupings. The chart's bold dividers between periods reinforce the pattern visually.
What if I need to go higher than millions?+
The chart stops at millions for space reasons. Numbers in the billions or trillions need additional periods to the left — students can extend the chart by hand, or use a wider paper size. For curriculum purposes, millions is usually enough through grade 5; billions and trillions come up in grade 6+ contexts.
Do I need the decimal columns?+
Depends on grade. K–3 typically works only with whole numbers; grade 4+ extends to decimals. The decimal portion of this chart is helpful for the transition but can be ignored for whole-number work. If the decimals add visual noise, a whole-number-only version would be a sensible variant; we may add one if there's demand.
How is this different from a [hundreds chart](/graph-paper/hundreds-chart)?+
A hundreds chart is a 10×10 grid containing the integers 1–100 arranged sequentially — used for skip-counting, pattern recognition, and early arithmetic. A place value chart shows the structure of multi-digit numbers by separating them into columns by place value — used for understanding base-10 notation. The two charts serve different purposes in early math instruction.
Can I use this for non-base-10 systems?+
The structure (columns for each power) carries over to binary, octal, hexadecimal, and any other place-value system. But the period grouping (by threes) is base-10-specific because of how English reads thousands and millions. For non-base-10 instruction, you'd use a different layout.
Printing tips for best results+
- 1. Click Print above. A new tab opens the template at exact size.
- 2. The print dialog appears automatically. Set Scale to 100%. Never "Fit to page", which silently shrinks every cell.
- 3. Set Margins to None or Minimum so the grid reaches the page edge.
- 4. For a PDF, click Download instead. It generates a vector PDF directly without going through the printer driver.
You might also like
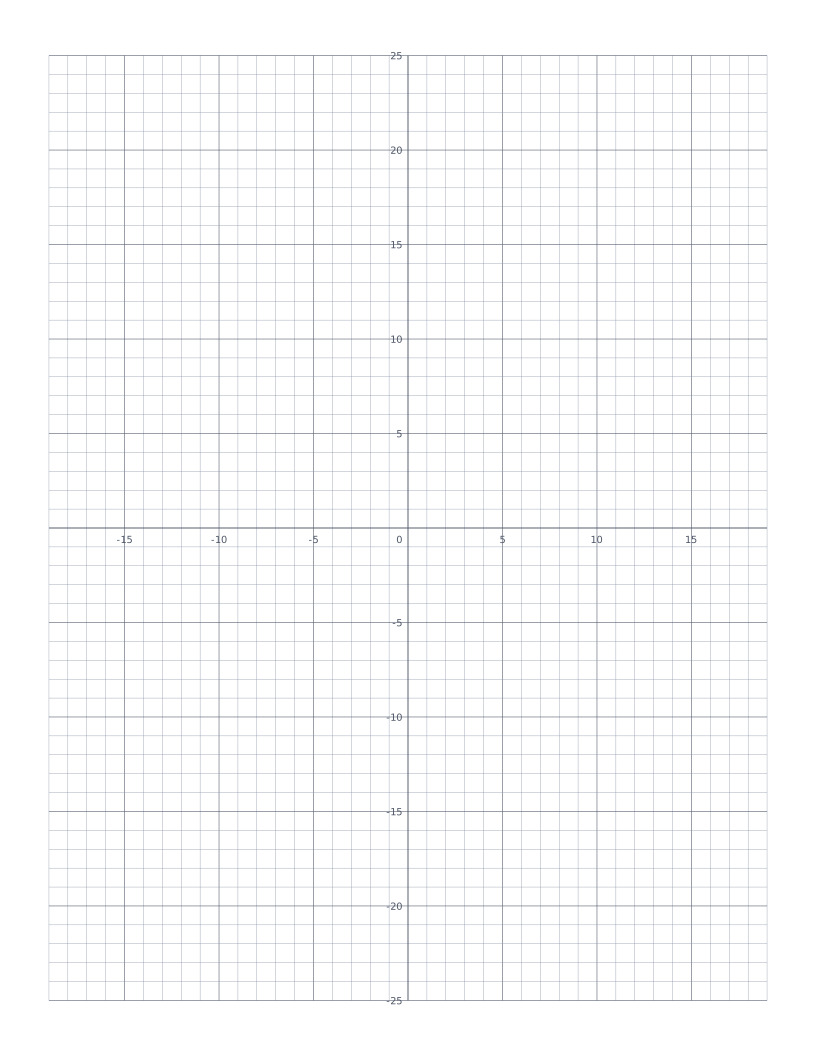
Coordinate Plane
Cartesian grid with numbered x and y axes through the centre: four quadrants for plotting points and graphing functions.
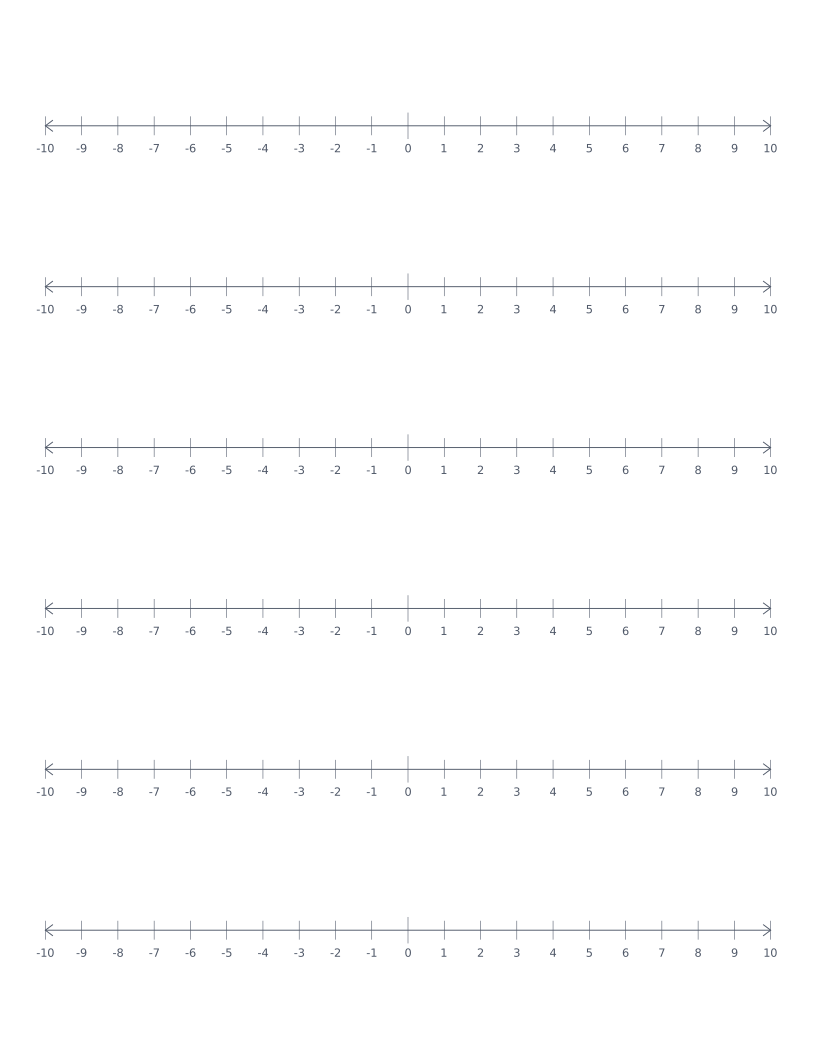
Number Line
Stacked number lines from -10 to 10: for elementary math, addition, subtraction and integer practice.
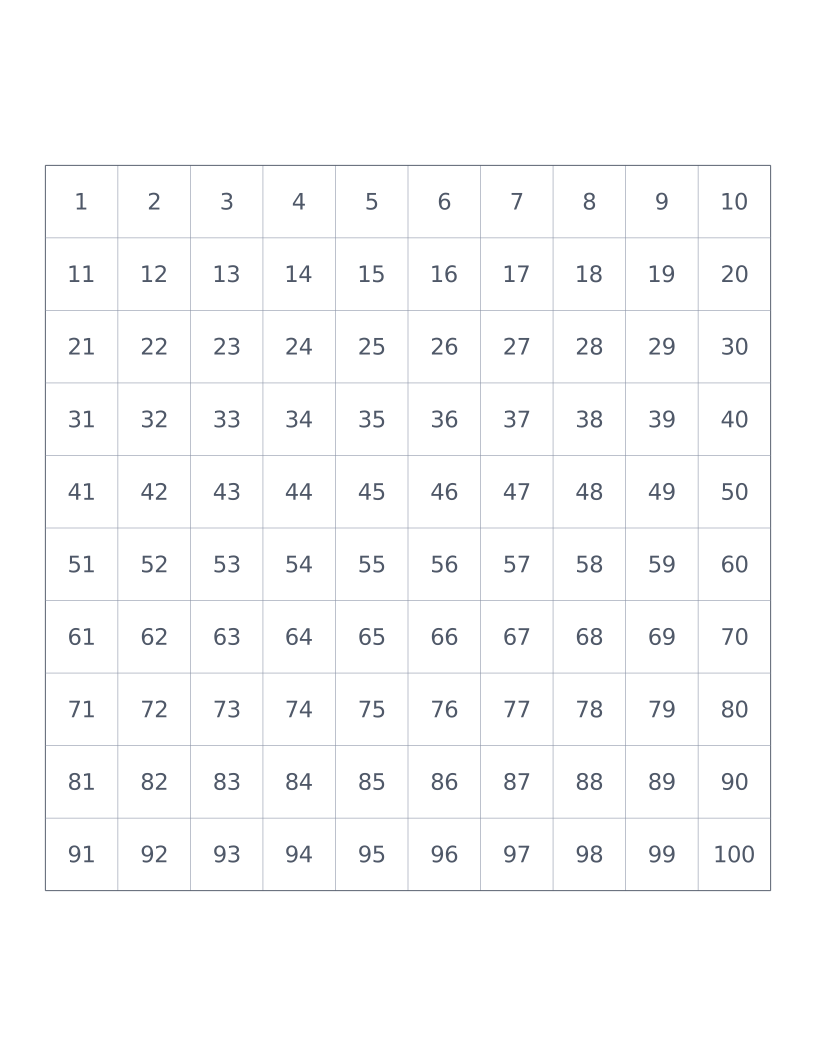
Hundreds Chart
10×10 grid numbered 1 to 100: a classroom staple for counting, place value and skip-counting.
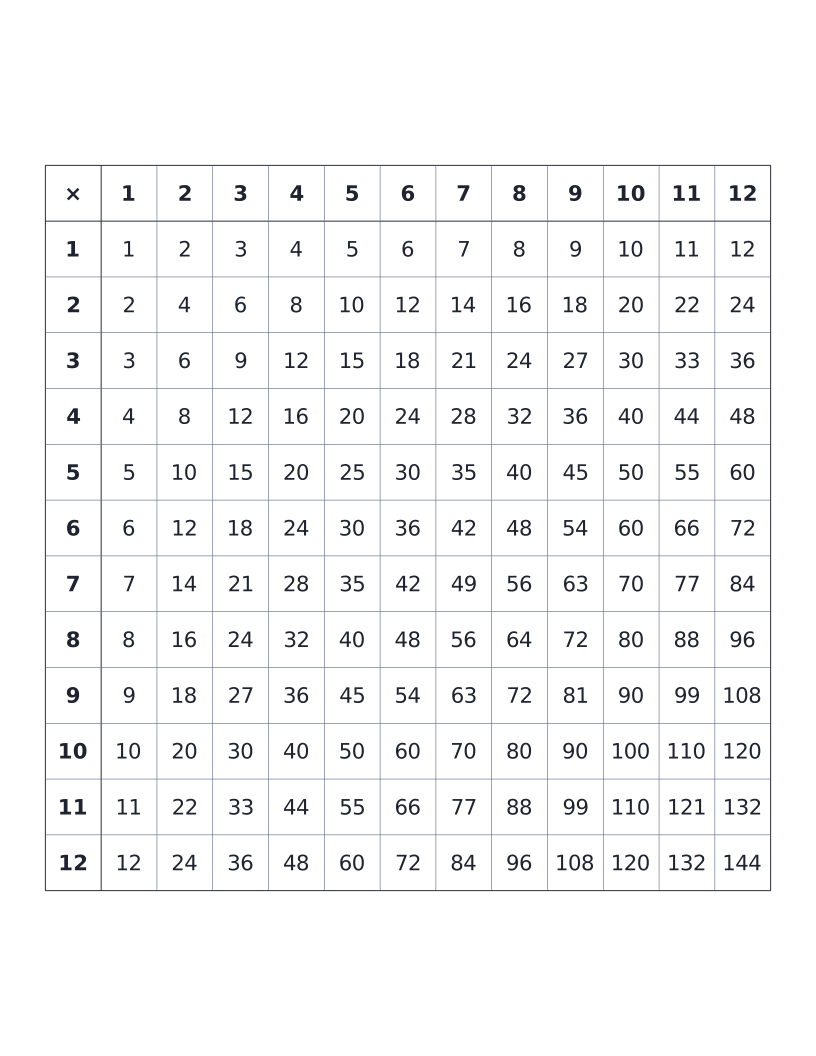
Multiplication Table (12×12)
12×12 times table with all products printed: the classic elementary reference chart.