Live preview · Letter (8.5" × 11") · Dark lines
Multiplication Table (12×12)
A 12×12 multiplication table with every product printed. The single most-referenced chart in elementary math: tape it inside a binder, stick it on the fridge, fold it into a homework folder. The format hasn't changed in over a century because nothing has improved on it.
Download generates a crisp vector PDF directly, no print dialog needed.
Choose a different paper size:
Choose a different line color:
Great for
- Memorising times tables in grades 2–4
- Homework help and quick lookup during math practice
- Discovering patterns in multiples (squares on the diagonal, symmetry across it)
- Reference card for early division (read the table in reverse)
Multiplication Table (12×12) at a glance
| What it is | 12×12 times table with all products printed: the classic elementary reference chart. |
|---|---|
| Category | Math & Learning |
| Paper sizes | Letter (8.5" × 11"), A4 (210 × 297 mm), 11" × 17", Legal (8.5" × 14"), A3 (297 × 420 mm), A2 (420 × 594 mm), Poster (18" × 24"), Movie Poster (27" × 40") |
| Line colors | Faint, Light, Gray, Dark, Black, Blue, Green (default: Dark) |
| Format | Vector PDF download at exact physical scale, or print directly from the browser |
| Price & license | Free. No signup or watermark. Printed sheets may be used for personal, classroom and commercial work. |
About multiplication table (12×12)
The multiplication table is one of the oldest pedagogical tools still in everyday use. Babylonian tablets from around 1800 BC show essentially this layout, and the Pythagorean table, named after the school but probably older, is its direct ancestor. The reason it's still printed and taped to refrigerators four millennia later is that no replacement has ever improved on it: a glance gives you the product, and the spatial relationship between cells reveals algebraic structure that pure rote memorisation can't. Perfect squares form the main diagonal. The table is symmetric across that diagonal because a·b = b·a. The multiples of 9 contain a pattern (digits summing to 9) that schoolchildren still discover for themselves. The 12×12 version (rather than 10×10) is standard in the English-speaking world because of the imperial system: twelve inches in a foot, twelve months in a year, and the awkward fact that learning up to 12×12 is genuinely useful for mental arithmetic in everyday life.
What's on the page
A 13×13 grid: a header row and column of factors (1 through 12) plus the 12×12 body containing every product. The corner cell holds a × symbol to identify the operation. The header row and column are drawn with heavier lines than the interior, so the boundary between 'inputs' and 'products' is visually obvious. Numbers are centred in each cell and sized to fit comfortably without crowding. The full table fits squarely on Letter or A4 with generous margins.
How to use it well
Use it for division, not just multiplication
To find 56 ÷ 7, look down the 7 column (or row) until you find 56. The header value on the perpendicular axis is the quotient. The table is a complete reference for both operations.
Highlight the diagonal for squares
1, 4, 9, 16, 25, 36, … run down the main diagonal. Highlight them in colour and the structure becomes a teaching tool: squares are the special case where the two factors are equal, and they're the cells you can use to anchor mental estimation.
Notice the symmetry
Every product appears twice (except squares). 6×8 and 8×6 are the same cell content reflected across the diagonal. Pointing this out to students teaches commutativity visually, which is faster than explaining it algebraically.
Cover and quiz
Print two copies. Use one as reference, cover cells on the other with sticky notes and quiz from memory. The visible grid structure helps students notice when they've answered every cell, and gives an obvious progress signal.
Common mistakes to avoid
- Treating the chart as a substitute for memorisation. The table is a reference and a learning aid, not a calculator. Students who rely on the chart for every product never internalise the facts, which slows down every subsequent math topic that depends on fluent multiplication.
- Printing too small. The 12×12 grid has 169 cells; on a half-page printout, the numbers become hard to read. Always print at full Letter or A4 size for desk use; only shrink for binder-tab reference cards.
- Stopping at 10×10. In US classrooms 12×12 is the convention, and stopping at 10 leaves out the 11s and 12s, both of which appear constantly in everyday arithmetic (dozen-based pricing, time, inches in a foot).
FAQ, Multiplication Table (12×12)
Why 12×12 and not 10×10?+
Convention. Anglophone math education traditionally tops out at 12 because of dozen-based units (inches, months) where multiplying by 11 and 12 comes up in daily life. Metric-only systems sometimes stop at 10×10. Both are defensible; the 12×12 chart is more comprehensive and only marginally harder to memorise.
Is there a blank version for practice?+
Not on this page, this template is the fully-filled reference. A blank version (header rows and columns filled, body empty) is a separate practice tool that we may add later. For now, you can cover cells with sticky notes to create your own practice worksheet.
How should kids actually learn this?+
Research suggests a mix of conceptual understanding (skip counting, arrays, repeated addition) and spaced retrieval practice (timed drills, quiz games). The chart is most useful in the first stage as a visual reference for spotting patterns, and in the second stage as an answer key. It is not a substitute for the practice itself.
What about division facts?+
The same chart works in reverse: to find 72 ÷ 9, find 72 in the 9 row (or column) and read off the header value (8). Division facts and multiplication facts are the same facts, just queried differently.
Should this be in colour?+
Black-and-white is the standard reference format and what most teachers prefer for handouts. If you want to use colour to highlight diagonals, squares, or specific tables (the 7s, the 8s), do that after printing with a highlighter. It teaches better than pre-coloured charts because the act of highlighting forces engagement with the structure.
Printing tips for best results+
- 1. Click Print above. A new tab opens the template at exact size.
- 2. The print dialog appears automatically. Set Scale to 100%. Never "Fit to page", which silently shrinks every cell.
- 3. Set Margins to None or Minimum so the grid reaches the page edge.
- 4. For a PDF, click Download instead. It generates a vector PDF directly without going through the printer driver.
You might also like
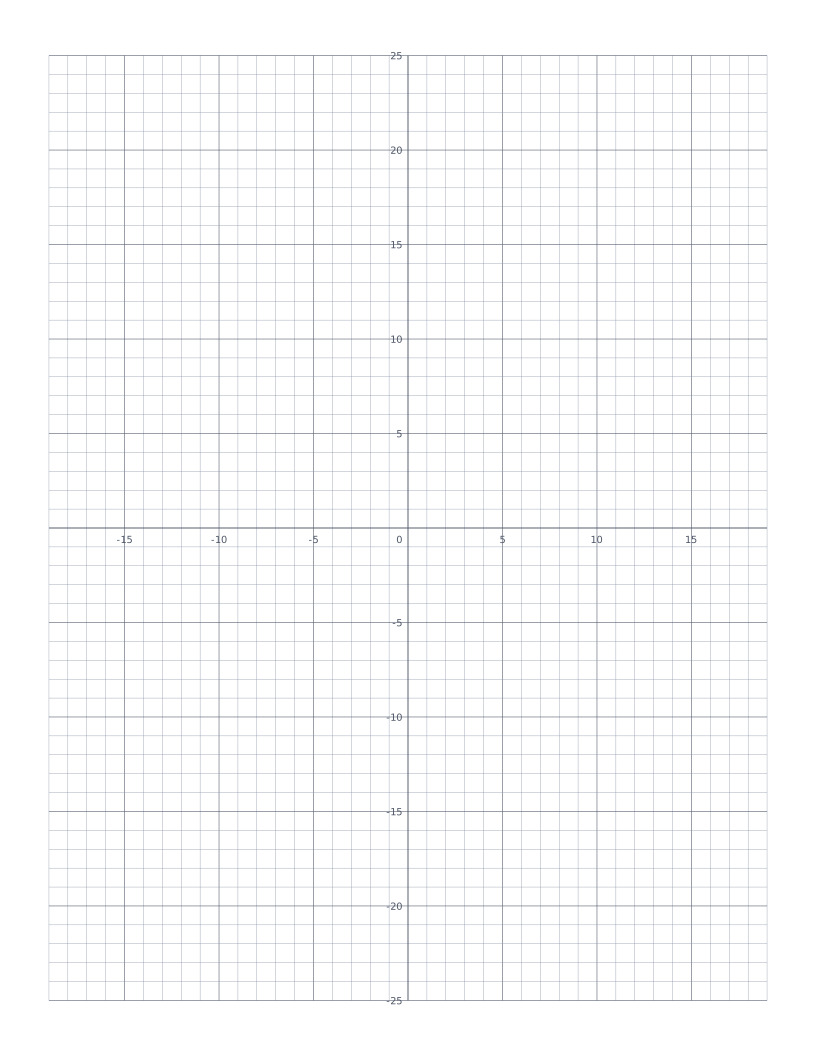
Coordinate Plane
Cartesian grid with numbered x and y axes through the centre: four quadrants for plotting points and graphing functions.
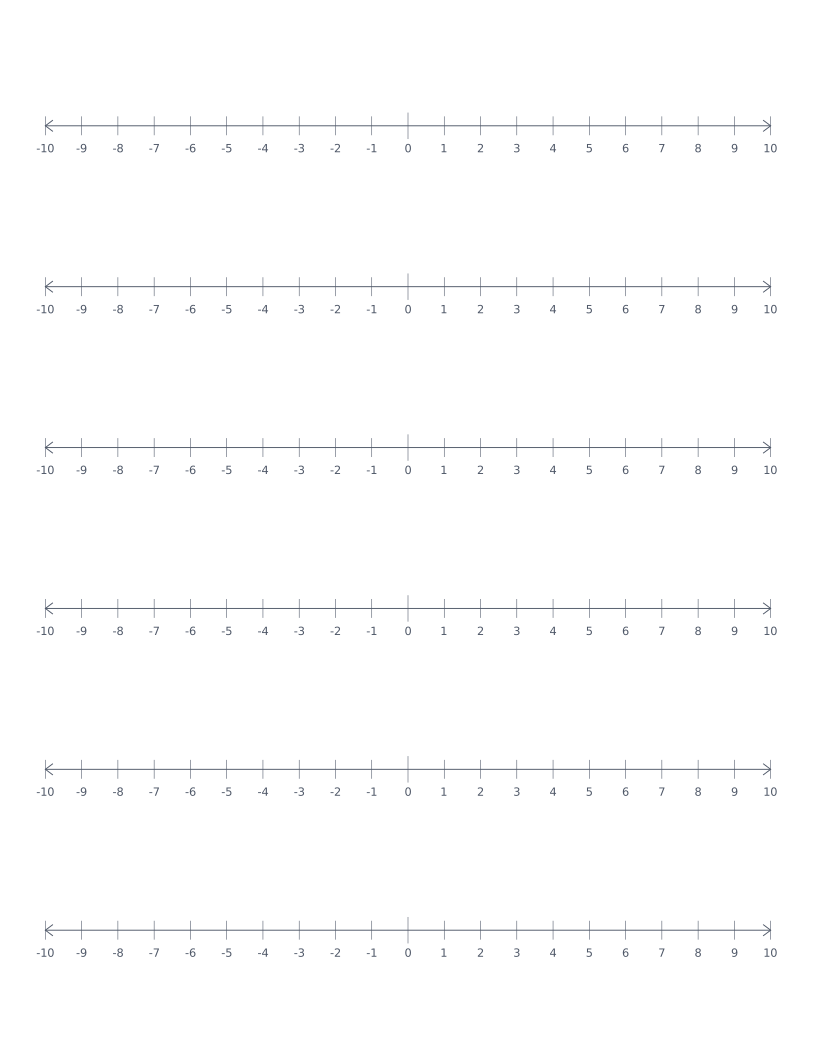
Number Line
Stacked number lines from -10 to 10: for elementary math, addition, subtraction and integer practice.
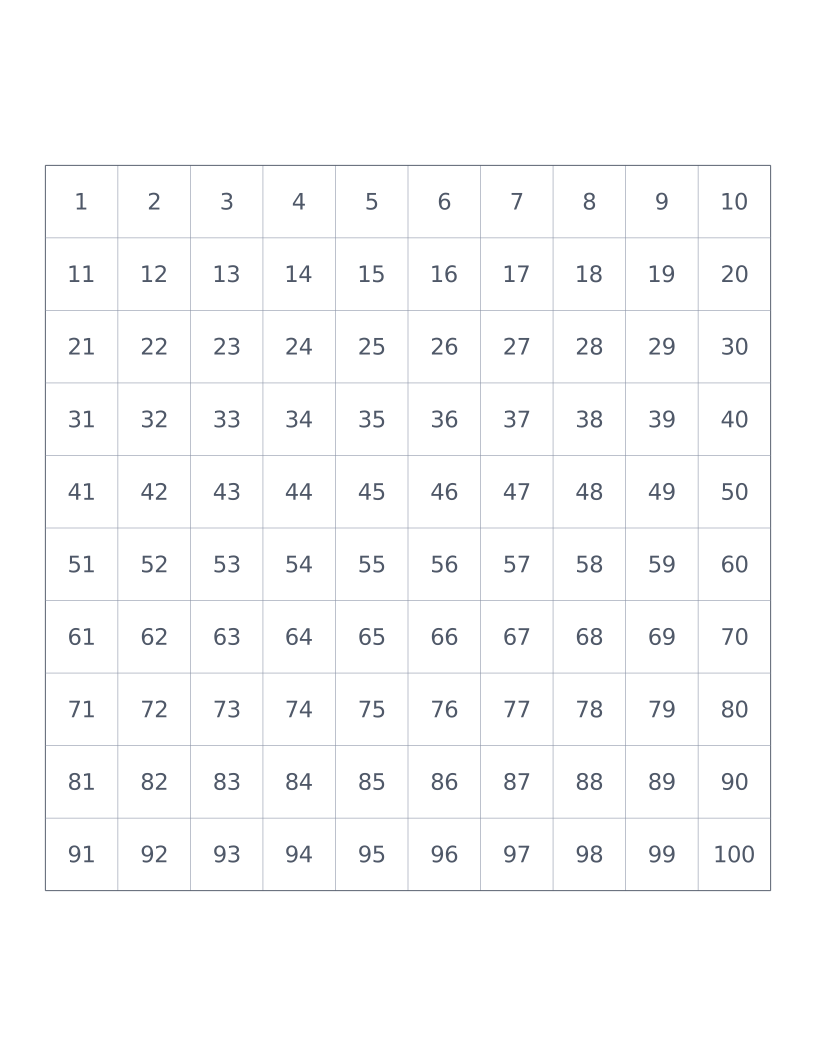
Hundreds Chart
10×10 grid numbered 1 to 100: a classroom staple for counting, place value and skip-counting.
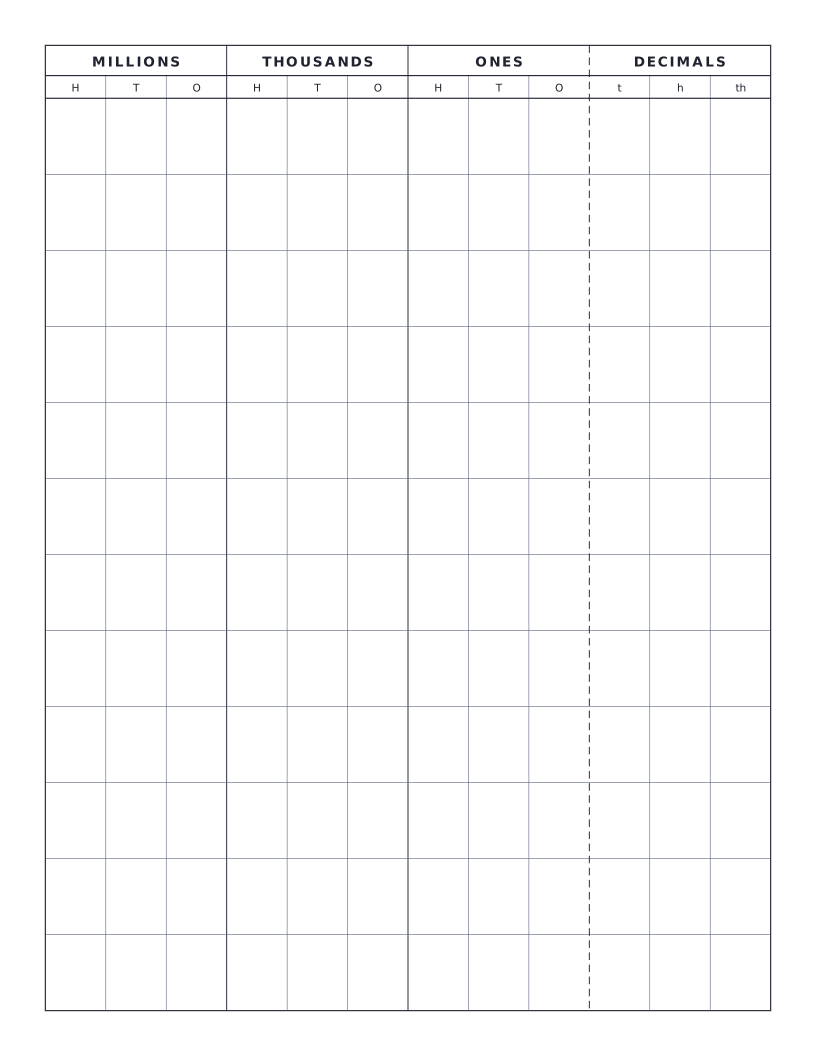
Place Value Chart
Standard place value chart through millions with optional decimals: groups columns by period (ones, thousands, millions) for clear reading.